


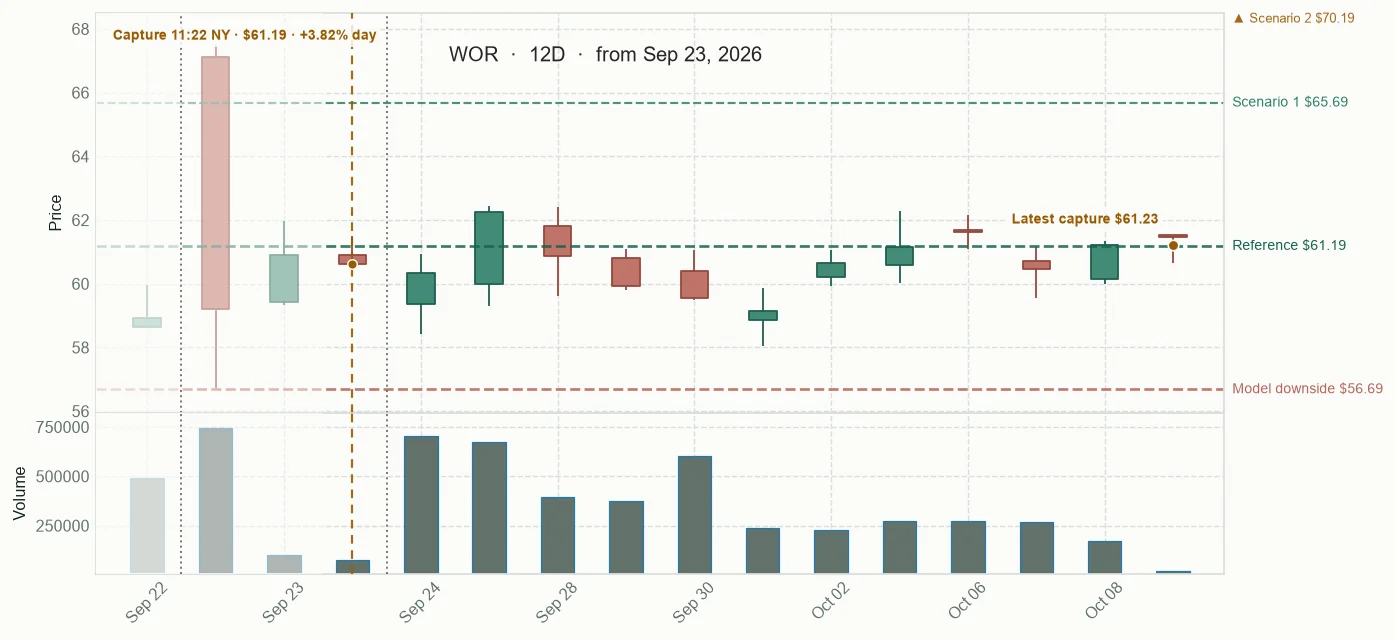
Panel thesis: Worthington's reported fiscal 2027 first-quarter sales grew 13% year over year, and adjusted EPS exceeded the supplied estimate. Its 20-session return also exceeded the Industrials proxy. The premarket rise faded by the decision cut, so the next fresh session is the key continuation check.
+3.82% · 2.67x volume · 58.6 > 58.18 > 57.2

Company context
Worthington Enterprises designs and manufactures building products and trade and specialty products for professional and consumer markets.
Committee read
This is the committee's read of the evidence, not a probability or score. The dated operating result and positive 20-session relative record make WOR the strongest S0–S15 case. Nate's CBRL objection remains valid because its latest event-day trajectory was stronger. WOR's fade, near-VWAP reading, and lack of future-session evidence keep the selection provisional.
Observed price path
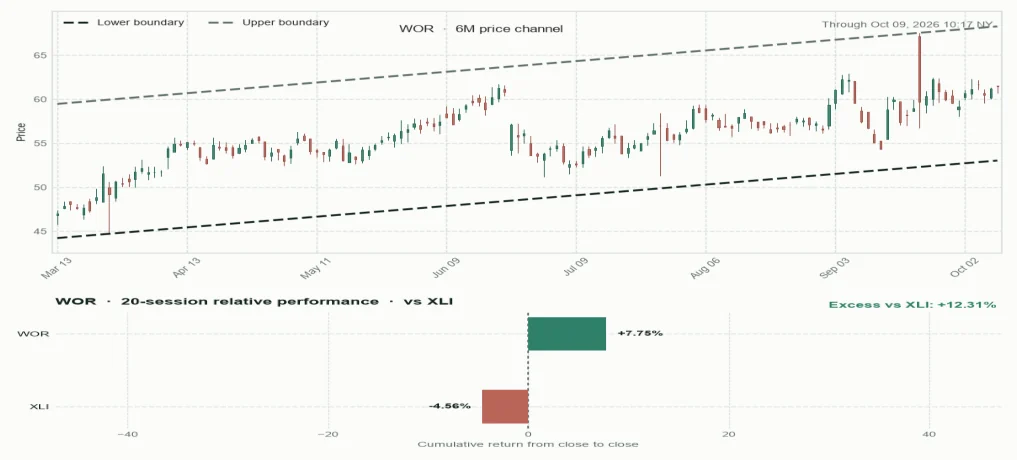
Price channel and relative performance
Forecast fan chart
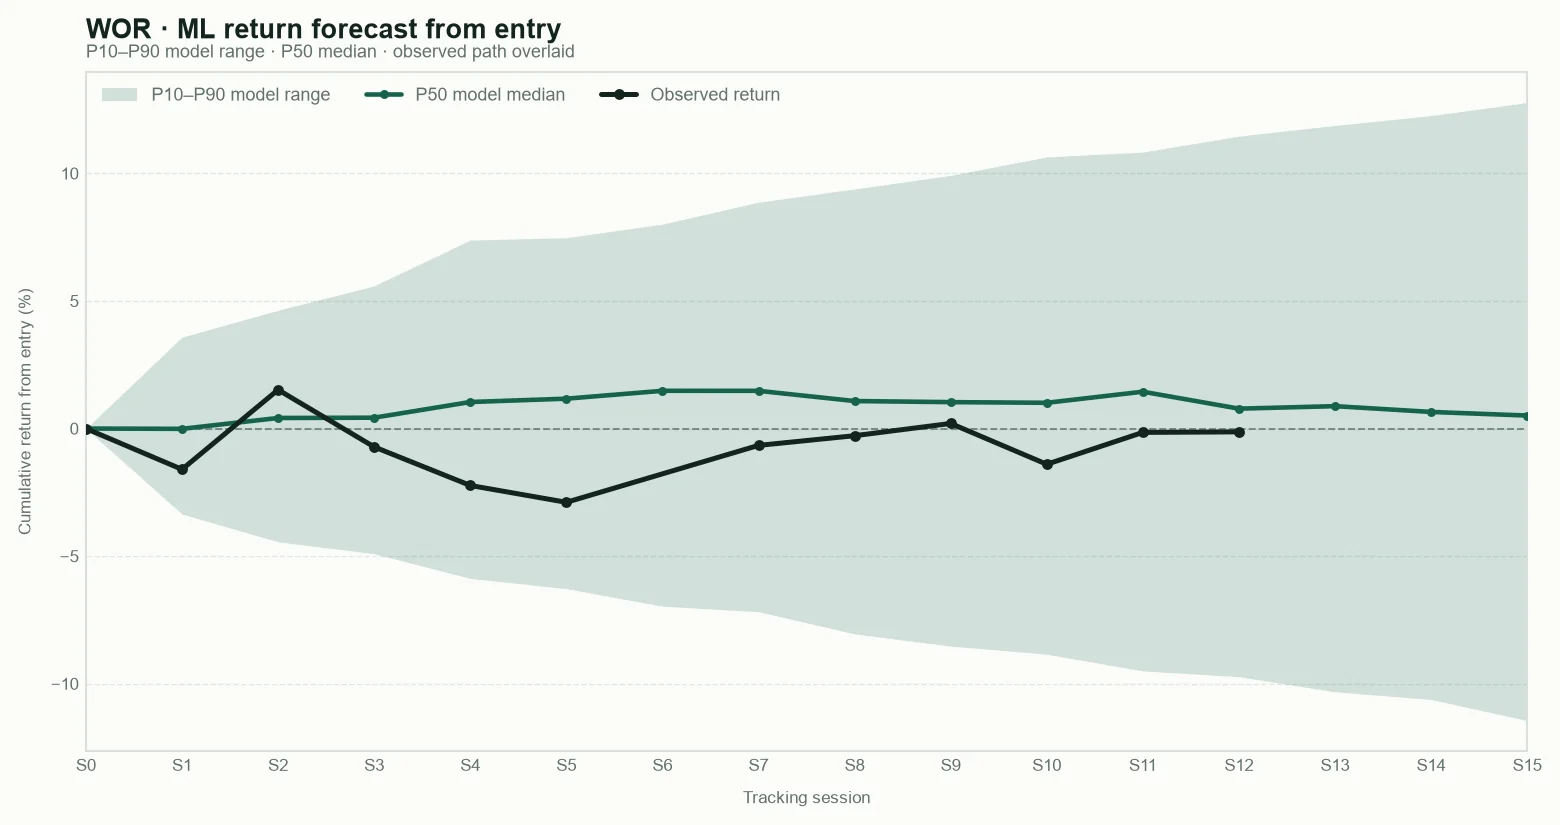
P10 — Cautious outcome: a weak result; most model estimates are above this level.
P50 — Central outcome: the middle estimate; roughly half of the model estimates are above and half below.
P90 — Favourable outcome: a strong result; only the most favourable model estimates are above this level.
These are model reference levels, not guarantees.
Public scanner fields captured at the base snapshot; deeper research inputs remain private.
Snapshot
What was captured at the base
Structure
How price is behaving
Risk and context
What may change the read
Base framework for context and outcome tracking. These are not trading instructions.
Tracking results
Observed daily-bar ranges are retrospective measurements, not targets, stops, or trading instructions.
Tryding Review
Five AI analytical agents reading the same evidence; disagreement stays visible.
“The broad picture is mixed. The captured S&P 500, Nasdaq 100 and Russell 2000 were lower. That snapshot was already outside its six-minute freshness interval by our cutoff, so it is a timestamped reading, not a closing picture.”
It matters. CBRL's 20-session return was −16.41% against −6.53% for its Consumer Discretionary proxy. That is a substantial relative hole. Today's earnings response may be a turn, but one session has not yet shown that the longer weakness has changed.
“The flash PMI—a survey where readings above 50 mean surveyed businesses report expansion—came in at 57.0 for manufacturing, 58.7 for services and 58.4 for the composite. But the 10-year Treasury yield was captured at 5.096%, with a displayed increase of 12.80 basis points. Higher yields raise financing costs and the hurdle for future cash flows.”
GIS reported an earnings beat, but its last pre-cut trajectory was still −0.31%, after a partial recovery. The prepared SEC fundamentals snapshot predates that report, so I will not use it as the current quarter. For BA, the packet's order item is not marked safe for public use; five positive observations over about 25 minutes do not replace that missing bridge.
Broader Market Context
Resilient flash business surveys met a weaker equity tape, firmer rates and dollar, and unsettled energy and geopolitical headlines. The intraday breadth proxy leaned negative, but end-of-day breadth was unavailable and the market snapshot had aged past its freshness window by the cutoff. Worthington’s results provide a company-specific data point within those cross-currents, not a market-wide explanation.
The day’s central tension was between business-survey optimism and market pricing. The September flash U.S. PMI readings were 57.0 for manufacturing, 58.7 for services and 58.4 for the composite, all above consensus. A PMI is a survey-based diffusion index: above 50 means expansion was more common than contraction among respondents; it is not a percentage change in output. At the same time, the supplied 16:58 UTC snapshot showed the S&P 500, Nasdaq 100 and Russell 2000 lower, while the 10-year Treasury yield and dollar index were higher. That snapshot was complete when captured, but it was about 34 minutes old at the sealed cutoff and past its six-minute freshness interval. It describes that observation, not a synchronized closing tape. The broad intraday breadth proxy leaned negative, suggesting weakness extended across its sampled names, but its end-of-day layer was unavailable. The room treated that as a participation warning with a time boundary, not as a final market reading. Public reporting also left the energy picture unsettled: Reuters described oil near two-week lows, Kpler outlined the possible effects of U.S. diesel-export curbs on domestic and overseas supply, and Reuters reported that Iran’s president held open both resistance and diplomacy. Those reports describe competing risks; they do not establish why markets moved. The Wall Street Journal’s account of dollar strength alongside rate-hike expectations added another pressure point. Worthington’s fiscal 2027 first-quarter release is a useful company-level example of the wider split. Net sales increased 13.2% year over year, while sales excluding recent acquisitions increased 6.9%; that latter measure is the company’s organic growth. Segment detail was mixed: Building Performance Solutions’ sales growth included acquisition contributions and its adjusted EBITDA was described as relatively flat, while Trade & Specialty Solutions reported higher sales on higher volume and selling prices. The discussion therefore kept the survey, market tape, breadth proxy and issuer results distinct. Activity resilience and risk pricing can coexist, but this evidence does not make one company’s report a stand-in for the whole industrial cycle.
Sources consulted: LizAnnSonders · Reuters · Reuters · Kpler · The Wall Street Journal
Coffee conversation
“There is a real split in the day: September’s flash PMI readings came in above consensus, while the market snapshot was under pressure. A PMI is a survey-based diffusion index; above 50 means expansion was more common than contraction among respondents. It signals activity, not a guaranteed earnings result.”
“Just to pin down the scale: a manufacturing PMI of 57 does not mean manufacturing output grew 57%, right?”
“Right. It is not a growth percentage. It summarizes the balance of survey responses; the practical point is that more respondents reported expansion than contraction, but it says nothing by itself about a company’s earnings.”
“The 16:58 UTC snapshot still showed the S&P 500 down 0.78%, the Nasdaq 100 down 1.10% and the Russell 2000 down 1.36%. The 10-year yield’s reported change was +12.80 basis points, or 0.128 percentage points, which raises a market reference borrowing rate. The capture was complete, but about 34 minutes old at the sealed cutoff—well beyond its six-minute freshness interval.”
“The energy and policy stories did not point in one direction. Reuters reported oil near two-week lows, while its Iran update left both continued conflict and diplomacy in view. Those are conditions to watch, not a proven explanation for the equity move.”
“And Kpler’s diesel-export-curb item is conditional: it describes how a curb could lower domestic prices while tightening supply for Europe and Latin America. That is a cross-border supply risk, not a confirmed change in Worthington’s costs. The dollar and rate backdrop adds pressure, but the reporting does not prove a causal chain.”
“Agreed on causation. I’m saying the supply headlines widen the range of possible effects across businesses; they do not tell us which company benefits or absorbs the cost.”
“The Russell’s larger decline than the S&P 500 is a useful structural clue: smaller companies were under more pressure in that capture. It is broad context, not a ranking rule for any single issuer.”
“The intraday breadth proxy also leaned negative. Breadth compares how many sampled stocks advance versus decline; when decliners dominate, weakness is less confined to a few large names. The end-of-day breadth layer was unavailable, so that remains an intraday warning.”
“That time boundary matters. The breadth reading was captured at 16:35 UTC, the index and rates snapshot at 16:58, and the sealed cutoff was 17:32 UTC. These are dated observations from different captures, not one simultaneous closing picture.”
“Worthington’s release offers a company-specific datapoint: first-quarter net sales increased 13.2% year over year, and the company reported 6.9% organic growth—sales growth excluding acquisitions. Its own segment results were not uniform, which is another reason not to call one report a sector-wide turn.”
“That is the balance I would keep: survey activity looked resilient, while indexes, rates and the intraday breadth proxy described a more cautious market. The useful context is the divergence itself; these captures do not resolve what follows for the market or for any one company.”
Timeline
WOR's tracked return slipped 0.84 points to -1.56%, although the captured $60.65 price sat almost on the $60.63 session VWAP and remained above the published $58.94 prior-close reference. Its 20-session lead over Industrials narrowed to 8.76 points from 12.38 at the last transcribed panel, while dollar volume is only 0.04 times its 20-day average. The fade weakens follow-through without meeting the thesis's full failure condition; reported sales growth remains untested for durability.
WOR’s tracked return swung 3.42 points from −1.90% to +1.52% as the late quote reached $62.24, 2.59% above VWAP on 1.42 times its 20-day dollar volume; it remains 12.38 points ahead of Industrials over 20 sessions. That is stronger follow-through for the earnings thesis, with price above the $58.94 reference, but the structure is unconfirmed and this session cannot establish that reported growth will persist.
Panel thesis: WOR's reported Q1 growth and relative strength before S0 make continuation through S1–S15 more defensible than the alternatives. The thesis depends on the earnings reaction holding up against its Industrials proxy; the premarket fade means follow-through remains unproven. Invalidation boundary: A full retracement to or below the $58.94 prior regular close, followed by continued underperformance against the Industrials proxy across fresh observations, would falsify the continuation thesis.
Panel comparison
Selected candidate versus the alternatives retained from the panel comparison.
Latest display-only snapshot · Oct 9, 2026 · 10:49 NYSE
Since base +0.18% · Today +0.13% · Since prior +0.13% · Relative volume 0.02 · RSI 63.43 · EMA 60.73 > 59.97 > 58.8 · VWAP above +0.27% · 52-week high 90.80% · As of Oct 9, 2026 · 10:06 NYSE
Since base +0.11% · Today -0.02% · Since prior 0.00% · Relative volume 1.24 · RSI 33.07 · EMA 47.04 > 50.02 > 52.4 · VWAP above · 52-week high 78.61% · As of Sep 23, 2026 · 17:08 NYSE
Since base -6.63% · Today +8.62% · Since prior 0.00% · Relative volume 5.59 · RSI 56.35 · EMA 5.01 > 4.97 > 4.88 · VWAP above · 52-week high 67.61% · As of Sep 23, 2026 · 17:09 NYSE
Since base +1.30% · Today -0.06% · Since prior 0.00% · Relative volume 0.85 · RSI 12.59 · EMA 36.41 > 37.33 > 37.36 · VWAP above · 52-week high 68.70% · As of Sep 23, 2026 · 16:55 NYSE
Since base -0.71% · Today +0.03% · Since prior 0.00% · Relative volume 1.03 · RSI 44.18 · EMA 203.21 > 207.71 > 212.97 · VWAP below · 52-week high 79.26% · As of Sep 23, 2026 · 17:08 NYSE
Company dossier
History, curiosities & sources
Selected facts and links behind the public profile.
Company description
Worthington Enterprises designs and manufactures products for building systems, climate and comfort, and trade and specialty applications. Its Building Performance Solutions business serves residential and commercial building markets, while Trade & Specialty Solutions includes brands for tools, portable propane and helium, and other specialty uses. Its portfolio includes brands such as Balloon Time, Bernzomatic, Coleman propane cylinders and Well-X-Trol. The company is headquartered in Columbus, Ohio.
History
- Founded in Columbus, Ohio, in 1955 as Worthington Industries, beginning with custom-processed steel.
- In 1966, the company began sharing profits with employees and placed production workers on a salary plan.
- Worthington Industries made its first public stock offering in 1968 and moved to the New York Stock Exchange in 2000.
- On December 1, 2023, its former steel-processing business became the independent public company Worthington Steel; Worthington Enterprises continued trading as WOR.
Curiosities
- Founder John H. McConnell borrowed $600 against his 1952 Oldsmobile to buy the company’s first load of steel; a replica of the car is kept at company headquarters.
- Worthington says its engineered ASME tanks are used in liquid-cooling systems for data centers.