


TrydingDay · Learn
AMC: An Upward Signal Put to the Test
A retrospective teaching case showing how a visible signal was tested across fifteen sessions.
The story in brief
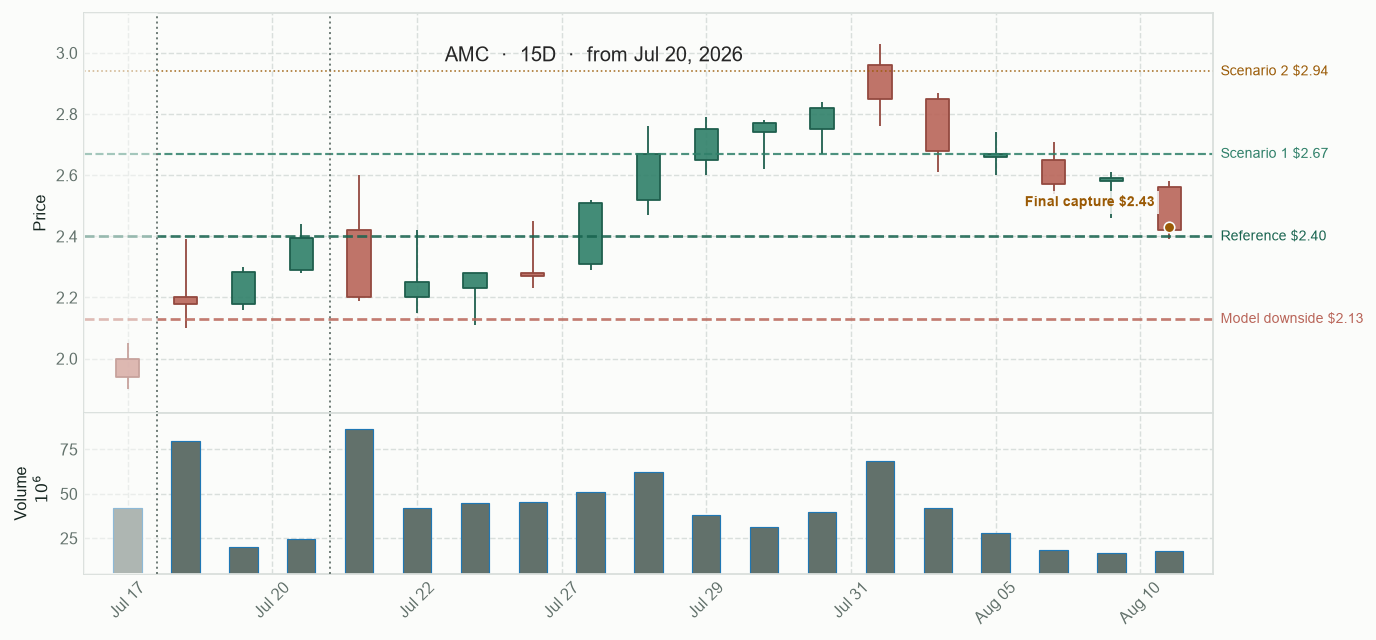
AMC was selected after a strong upward session, moving from roughly +16.5% to +23.71% and finishing near its observed highs. The first follow-up tested that signal: the stock fell to about -8.33% by day 1, recovered to +4.58% by day 5 and later climbed above +20% by day 10. It then gave back much of that progress, closing the 15-session follow-up at approximately +0.83%. The case showed how a real initial signal could recover and still fail to become a lasting advance.
Original publication
Observed price path
Broader context
A divided market backdrop
On July 20, the wider market was pulling in two directions. Brent moved above $90 amid the US-Iran escalation, while Wall Street futures rose as oil eased. That made the comparison selective: AMC had to show its own structure rather than borrow strength from the broader tape.
Day 0 – The selection
AMC entered the comparison after a strong session. Price moved from roughly +16.5% to +23.71%, held above VWAP and finished near the observed highs. A dated earnings-related report offered a possible mechanism for the interest.
The tape had been strong. It had not just moved up; it had held the move.
It had also held above VWAP — the session's volume-weighted average price, meaning the average traded price weighted by how much volume had changed hands at each level. AMC staying above that line had meant price remained above the session's main trading area; buyers had controlled the immediate structure.
The news had fit the reaction, but "fit" had been doing honest work here. A mechanism had been the plausible link between the report and the buying; it had not been confirmation.
Relative volume — that day's trading volume compared with AMC's usual volume — had already started to cool. The rise had been clear; follow-through — the ability to keep attracting demand after the first burst — had not yet been proven.
The label had been set on day one and had not changed with the follow-up. This had been a Raw Try: a concrete thesis worth testing. Try of the Day would have required fuller support across mechanism, structure and participation; Catch would have applied only if none of the candidates had cleared a researchable thesis.
Days 1-5 – The first setback and recovery
At the first follow-up close, AMC moved from the $2.40 reference to $2.20, about -8.33%. By the day-5 checkpoint, it had recovered to $2.51, about +4.58%.
We had first seen a reversal, then a recovery. Both had belonged in the same story.
We could not pin the drop on a cause the record had not established. Price had pulled back; the exact trigger had remained unknown.
The recovery had kept the thesis alive, but it had exposed the first risk: a rebound had not yet been durable follow-through. The signal had still needed to prove that demand could hold after the first shock.
Days 6-10 – More momentum, more pressure
AMC kept advancing: about +13.54% on day 7, +15.42% on day 8, +17.50% on day 9 and +20.42% on day 10.
By then, there had been a path, not just a one-day spike. The stock had recovered and had started building new highs.
The relative-volume reading had not always risen with the price. At points it had lagged, so the stock had been moving without the same increase in trading behind it. Price had advanced, but participation had not always grown with it.
The climb had included a shakeout — a fast drop that tested whether buyers would return: on day 8 it had slipped to roughly +10.83% before recovering. That had not cancelled the advance; it had shown that demand could still step away quickly.
The day-9 RSI had been around 77. RSI had summarized the recent balance and speed of gains and losses on a 0-to-100 scale; around 77, it had marked a hot, extended move, not a guaranteed reversal. On day 10, price had briefly lost VWAP before recovering, so the next push had been harder to trust.
Days 11-15 – What the rise could not keep
After the follow-up peak, AMC gave back part of the advance: roughly +14.17%, then +11.67%, +7.08% and +7.92%. At the 15-session close, the canonical result was about +0.83%.
The initial signal had been real. What had failed was its conversion into a stable progression.
The mid-course recovery had shown that the stock could respond, but the final result had not confirmed lasting follow-through.
Case takeaway
A valid signal does not guarantee durable follow-through
AMC was selected because its bullish signal was observable on day 0. The follow-up showed recovery, new advances and live risks inside the rising ranges, but it did not confirm stable continuation. The initial selection and later endurance were different questions.