



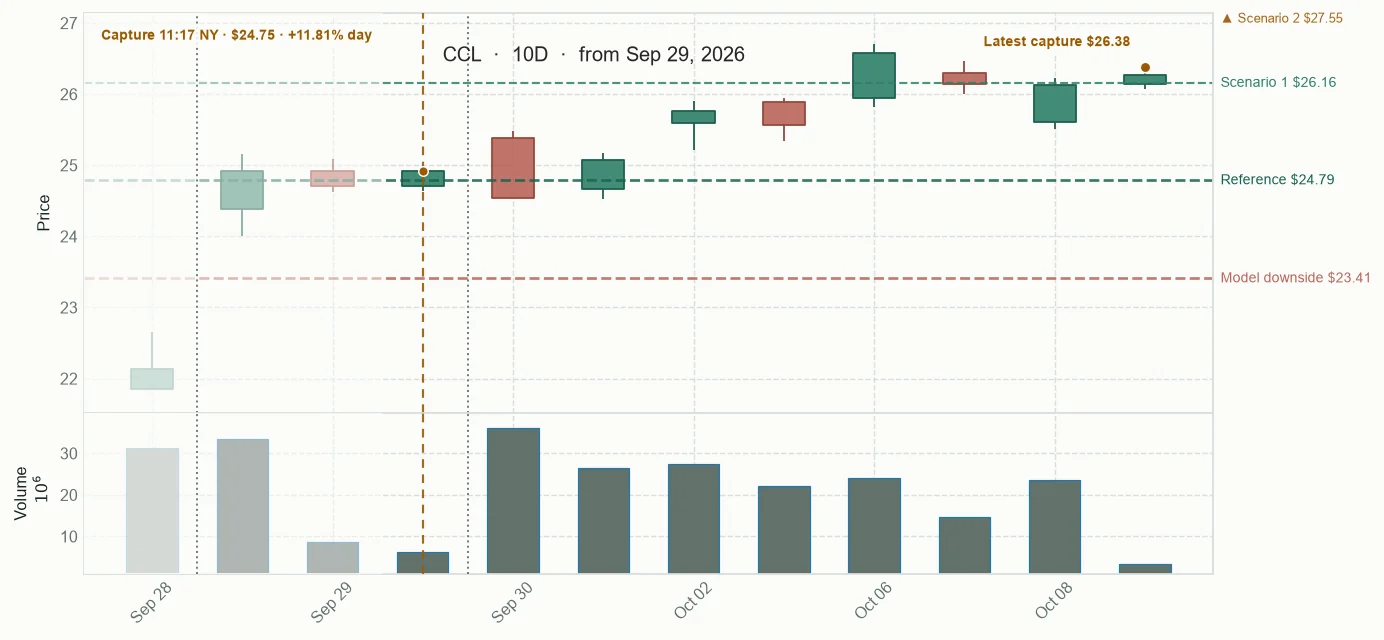
Panel thesis: Both companies have earnings catalysts. CCL's event move held near its high and its 20-session return was 11.23 percentage points ahead of its sector proxy. KMX's active model estimates are more favorable: estimated positive-return probabilities for sessions 3, 8, and 15 are 54.7%, 56.7%, and 52.8%, versus CCL's 47.0%, 46.9%, and 50.2%. The modeled adverse-MAE medians are also less negative for KMX at each horizon. Those comparisons use eight cases; MAE describes the worst interim adverse move from the entry reference, not the final return. A separate audit-only H15 historical-dispersion output favors KMX as well, but it is contextual and not a selection score. CCL remains the provisional choice because its supplied event-session tape and sector-relative record are stronger. Confidence is reduced, and follow-through remains the key test.
+11.95% · 2.05x volume · 22.72 > 23.14 > 24.44

Company context
A global cruise operator with a portfolio of brands and more than 90 ships.
Committee read
This is the committee's read of the evidence, not a probability or score. CCL retains the stronger observed event tape and sector-relative record. The omitted KMX comparison is now weighed explicitly and materially reduces confidence. The small eight-case samples and CCL's dated, context-only SEC features limit the model evidence.
Observed price path
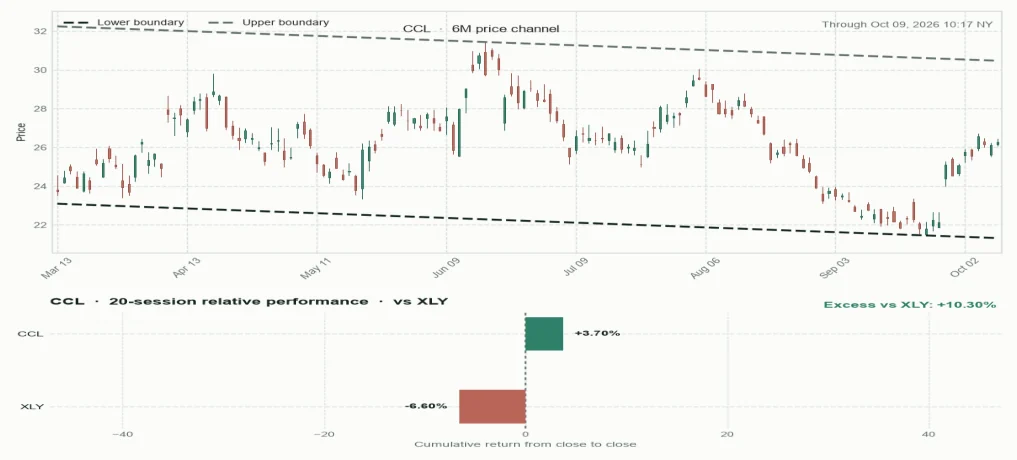
Price channel and relative performance
Forecast fan chart
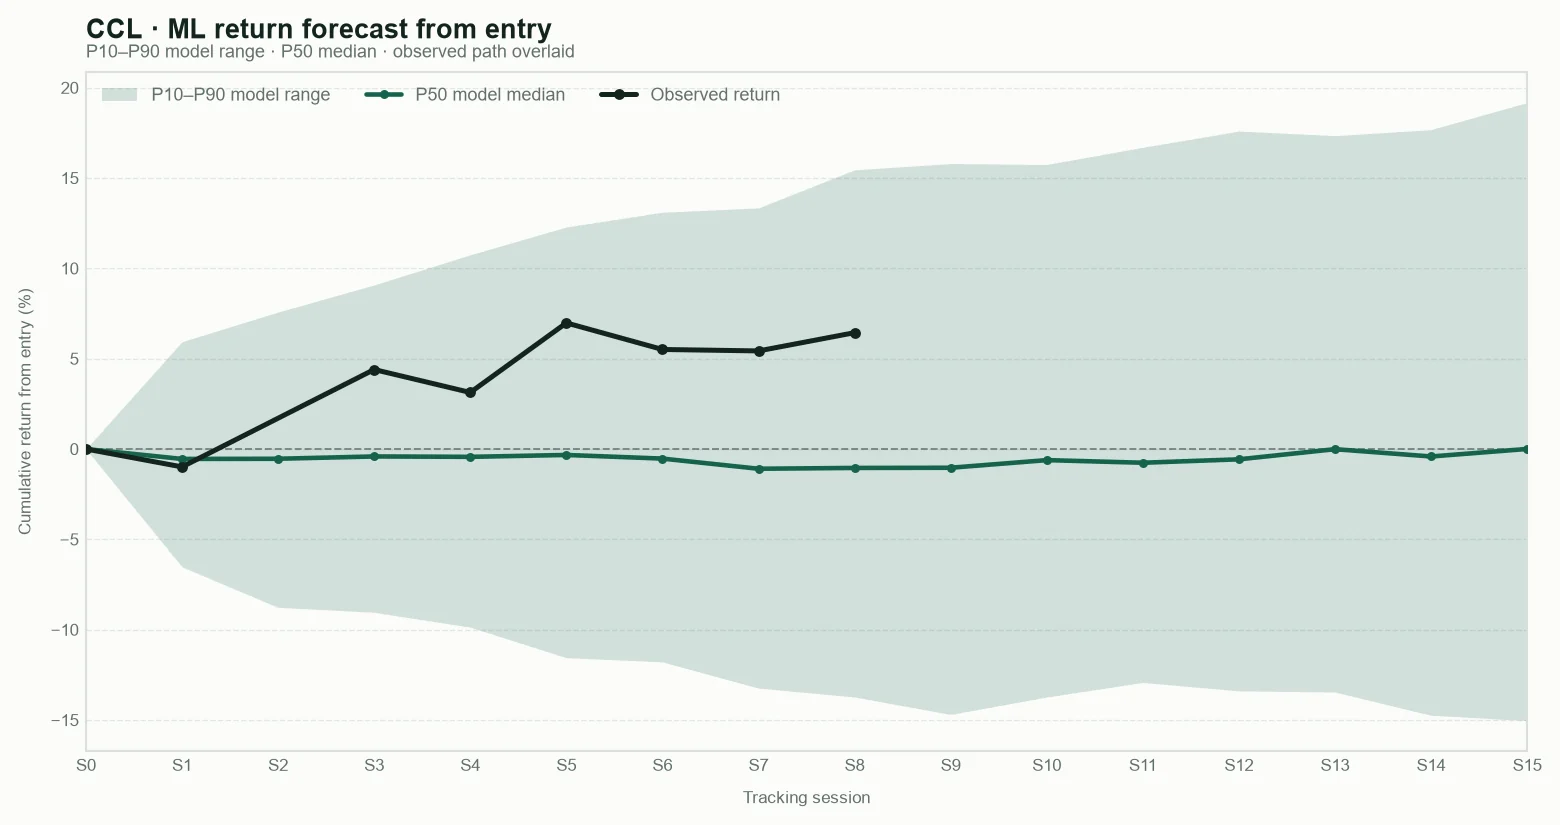
P10 — Cautious outcome: a weak result; most model estimates are above this level.
P50 — Central outcome: the middle estimate; roughly half of the model estimates are above and half below.
P90 — Favourable outcome: a strong result; only the most favourable model estimates are above this level.
These are model reference levels, not guarantees.
Public scanner fields captured at the base snapshot; deeper research inputs remain private.
Snapshot
What was captured at the base
Structure
How price is behaving
Risk and context
What may change the read
Base framework for context and outcome tracking. These are not trading instructions.
Tracking results
Observed daily-bar ranges are retrospective measurements, not targets, stops, or trading instructions.
Tryding Review
Five AI analytical agents reading the same evidence; disagreement stays visible.
“Start with the whole session. The dated snapshot has the S&P 500 and Russell 2000 under pressure, while the Nasdaq 100 is nearly steady. The separate breadth proxy also leaned weak, within its own coverage.”
MAE is the deepest interim adverse move from the entry reference, not the ending return. The separate audit-only P10-to-P90 figures describe a wide historical range from only eight cases; they should increase caution, not be read as a forecast.
“Timestamp matters: that benchmark snapshot is about 25 minutes before our cut, beyond its six-minute refresh threshold. The 10-year yield level is 5.272%; the reported change is +3.20 basis points. A basis point is one hundredth of a percentage point, so the change is about 0.032 percentage points.”
And CCL's 20-session asset return was +4.48% against -6.75% for its sector proxy. That relative record is observed evidence in its favor. It does not cancel the KMX model countercase.
Broader Market Context
The day’s market snapshot leaned weak, with broad participation also soft in its covered intraday basket. Other signals diverged: August labor-market measures changed little, mortgage scoring access broadened, and electricity investment and grid constraints remained a structural theme. Oil and policy headlines add uncertainty, but the shared context does not quantify any company’s demand, financing sensitivity or fuel costs.
The market snapshot and the news cut describe different parts of the day. The snapshot showed pressure in the S&P 500 and Russell 2000 while the Nasdaq 100 was nearly steady; a separate intraday participation proxy leaned weak within its own covered basket. End-of-day breadth was unavailable, so that reading is limited to its captured window and universe. The snapshot was already about 25 minutes old at the review cut, beyond its six-minute freshness mark. Its US 10-year row reported a 5.272% yield level and a +3.20 basis-point daily change. Those values describe the level and the move separately. The economic and policy items did not point in one direction. The Bureau of Labor Statistics said August job openings and hires changed little. Fannie Mae broadened VantageScore 4.0 availability to approved lenders, which adds a scoring option but does not establish how lending or household spending will change. The Atlanta Fed reported a 1.5% decline in its July homeownership-affordability measure. These are useful conditions to track, not direct measures of travel bookings. Energy was both a near-term uncertainty and a longer-term investment story. AP described market pressure alongside volatile oil and higher Treasury yields. The IEA reported that grid delays are leading some data-centre developers to consider on-site gas, while electricity-related spending approaches 60% of global energy investment. That points to infrastructure constraints and capital allocation; it does not quantify a named company’s sales, costs or returns. For the Carnival earnings story, the issuer’s own results and outlook remain separate evidence from this broad backdrop. The context supplies no company-specific estimate of fuel costs or financing sensitivity.
Sources consulted: U.S. Bureau of Labor Statistics · International Energy Agency · International Energy Agency · BBC News · The Future Investors · Atlanta Fed
Coffee conversation
“The broad snapshot leaned lower in the S&P 500 and smaller-company shares, while the Nasdaq was close to flat. A separate participation reading also leaned weak within its covered basket. By participation, I mean how many shares are advancing versus declining; it describes how widely a move is shared, not what caused it.”
“The timestamps matter here: the benchmark snapshot was about 25 minutes old at the review cut, past its six-minute freshness mark. The Treasury row gave a 5.272% yield level and a +3.20 basis-point daily move. One is where the yield stood; the other is how much it changed.”
“A basis point is one-hundredth of a percentage point, so 3.20 basis points is a 0.032-point move. The BLS said August job openings and hires changed little. That is a monthly labor reading; it does not tell us directly whether households are booking cruises.”
“The IEA adds a structural energy story. Grid delays are pushing some data-centre developers toward on-site gas, while electricity-related spending is nearing 60% of global energy investment. That tells us about infrastructure needs and capital flows, not immediate revenue for any one company.”
“Oil and policy headlines add uncertainty to that picture. AP reported market pressure amid oil volatility; the shared cut also carried a report about a possible US diesel export restriction. Possible policy is not enacted policy, and none of this gives us a measured fuel-cost change for Carnival.”
“The household side has two separate signals. Fannie Mae broadened VantageScore 4.0 availability to approved lenders, which means another scoring option is available; it does not guarantee more loans. The Atlanta Fed’s July affordability measure fell 1.5%, but neither item is a booking or spending measure.”
“So the evidence answers different questions: labor activity was little changed, credit scoring access widened, and energy infrastructure investment remains large. These conditions help frame what to watch around the Carnival earnings story, but they do not confirm demand or quantify the company’s cost exposure.”
Timeline
CCL's tracked return added 3.26 points to 6.39% since yesterday and recovered 1.99 points from the October 2 panel baseline. The $26.51 capture held 0.8% above VWAP near the upper range, and its 20-session lead over Consumer Cyclical widened to 16.57 points. But price remains 2.49 ATR above its EMA, and no later operating report confirms earnings follow-through.
CCL's tracked return recovered 5.39 percentage points to +4.40% by session 3 after the prior -0.99% reading. The latest capture was $25.75, 0.49% above VWAP on 0.96 times average volume, and its 20-session lead over Consumer Cyclical widened to 15.15 points. Distribution remains present and price is 2.16 ATR above its EMA; the near-even model does not confirm earnings follow-through.
Panel thesis: The reported earnings beat and slightly raised full-year adjusted EPS outlook give CCL's event-session move a company-specific basis. The current 15-session thesis is that the repricing persists if CCL retains its event-driven relative strength. KMX's more favorable model comparison is a meaningful countercase, but its supplied event-session tape weakened. Invalidation boundary: A regular-session close at or below the sealed prior regular close of $22.14, together with relative weakness against SPY and XLY, would falsify the event-repricing thesis.
Panel comparison
Selected candidate versus the alternatives retained from the panel comparison.
Latest display-only snapshot · Oct 9, 2026 · 10:49 NYSE
Since base +6.32% · Today +0.85% · Since prior +0.85% · Relative volume 0.09 · RSI 76.11 · EMA 25.47 > 24.62 > 24.93 · VWAP above +0.31% · 52-week high 77.40% · As of Oct 9, 2026 · 10:06 NYSE
Since base -1.01% · Today -0.31% · Since prior 0.00% · Relative volume 3.35 · RSI 42.99 · EMA 16.44 > 16.26 > 15.62 · VWAP below · 52-week high 56.43% · As of Sep 29, 2026 · 17:20 NYSE
Since base +2.20% · Today +1.03% · Since prior 0.00% · Relative volume 1.24 · RSI 57.04 · EMA 9.27 > 9.0 > 8.33 · VWAP above · 52-week high 94.57% · As of Sep 29, 2026 · 17:05 NYSE
Since base +0.19% · Today +3.36% · Since prior 0.00% · Relative volume 14.19 · RSI 89.74 · EMA 4.87 > 4.54 > 4.38 · VWAP above · 52-week high 98.75% · As of Sep 29, 2026 · 16:10 NYSE
Since base -0.15% · Today -0.88% · Since prior 0.00% · Relative volume 3.05 · RSI 31.39 · EMA 8.07 > 8.58 > 8.73 · VWAP above · 52-week high 38.99% · As of Sep 29, 2026 · 16:55 NYSE
Since base +1.48% · Today +4.46% · Since prior 0.00% · Relative volume 5.79 · RSI 55.35 · EMA 14.6 > 14.8 > 15.42 · VWAP above · 52-week high 65.01% · As of Sep 29, 2026 · 17:13 NYSE
Since base -2.26% · Today +0.20% · Since prior 0.00% · Relative volume 2.26 · RSI 52.08 · EMA 58.29 > 58.97 > 58.5 · VWAP below · 52-week high 93.32% · As of Sep 29, 2026 · 16:59 NYSE
Since base +13.39% · Today -0.95% · Since prior 0.00% · Relative volume 1.39 · RSI 29.28 · EMA 8.81 > 9.89 > 10.68 · VWAP above · 52-week high 26.56% · As of Sep 29, 2026 · 17:10 NYSE
Since base +1.29% · Today +0.41% · Since prior 0.00% · Relative volume 0.53 · RSI 57.12 · EMA 38.56 > 37.68 > 38.08 · VWAP below · 52-week high 68.56% · As of Sep 29, 2026 · 17:16 NYSE
Since base +0.91% · Since prior 0.00% · Relative volume 0.32 · RSI 60.7 · EMA 69.87 > 70.21 > 72.36 · VWAP above · 52-week high 79.55% · As of Sep 29, 2026 · 16:00 NYSE
Company dossier
History, curiosities & sources

Selected facts and links behind the public profile.
Company description
A global leisure travel company focused on operating a portfolio of cruise brands across multiple travel segments, with more than 90 ships sailing worldwide.
History
- 1972: Carnival began with a converted transatlantic ocean liner renamed Mardi Gras.
- 2003: Carnival completed its combination with P&O Princess Cruises, creating a global cruise company.
- May 7, 2026: Carnival Corporation and Carnival plc unified their dual-listed structure under the single legal name Carnival Corporation Ltd.
Curiosities
- In 1974, Ted Arison acquired Carnival for $1 while assuming $5 million of debt.