



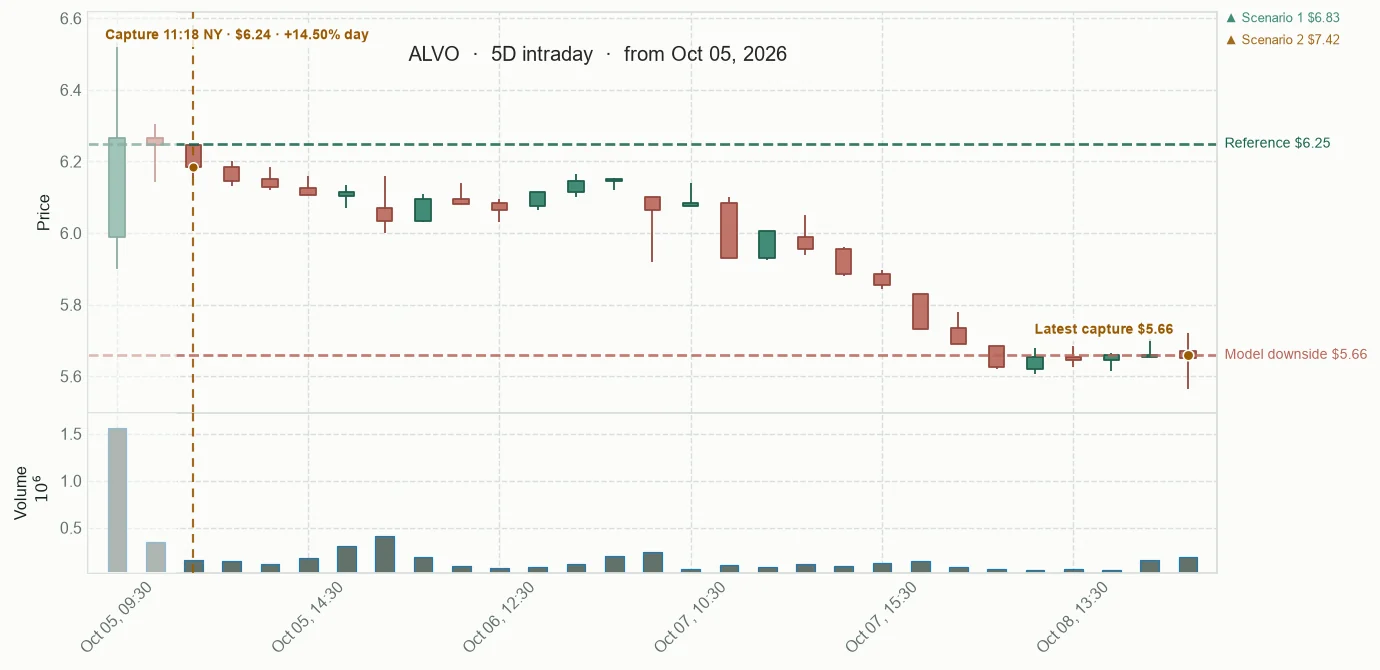
Panel thesis: Raw Try: ALVO. FDA approval for added SIMLANDI manufacturing capacity gives us a specific question to track: does that capacity enter U.S. commercial supply? The sealed evidence does not establish sales, and the captured tape weakened. The model context also carries a wide adverse tail and limited SEC-aware feature coverage. This is a research thesis, not a claim that the 15-session path is established.
+14.59% · 1.88x volume · 5.8 > 5.56 > 4.97

Company context
Alvotech develops and manufactures biosimilar medicines through an integrated production model and market-specific commercial partnerships.
Committee read
This is the committee's read of the evidence, not a probability or score. The Auditor found the Raw Try decision defensible and the ALVO thesis testable. Confidence remains bounded by unproven commercial impact, weaker captured tape, model downside uncertainty, and the substantive Caught dissent. These percentages express decision confidence, not a model forecast or vote count.
Observed price path
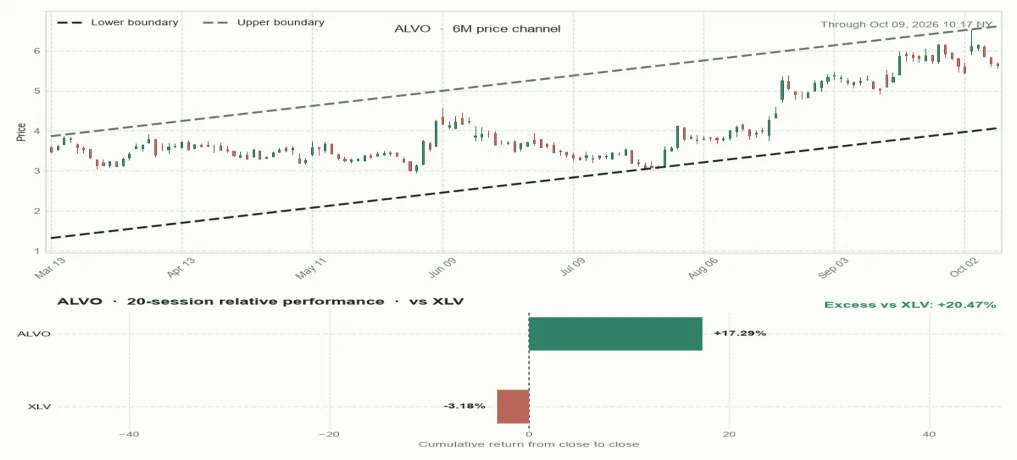
Price channel and relative performance
Forecast fan chart
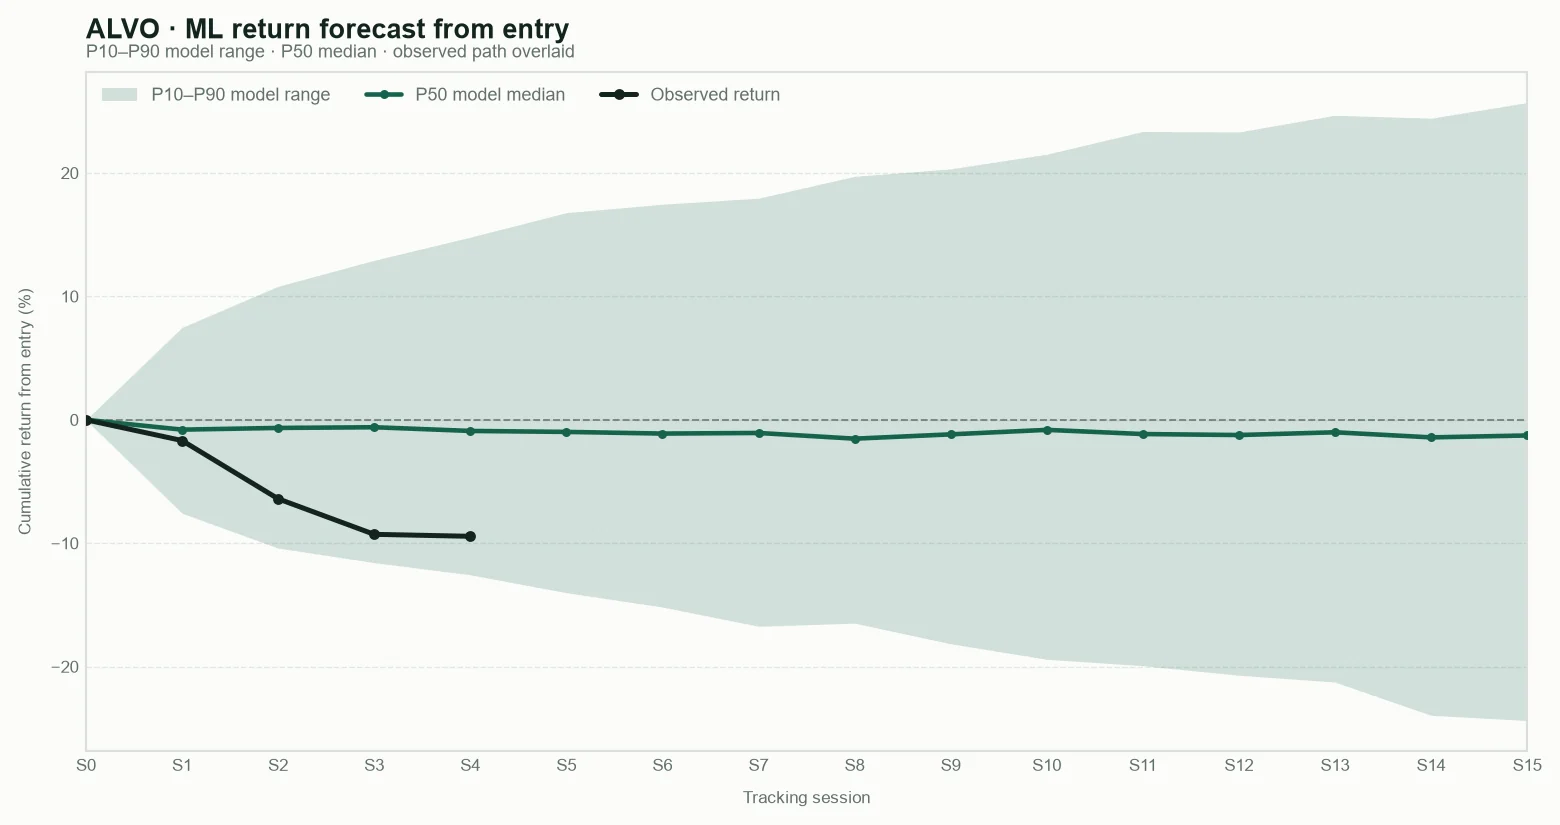
P10 — Cautious outcome: a weak result; most model estimates are above this level.
P50 — Central outcome: the middle estimate; roughly half of the model estimates are above and half below.
P90 — Favourable outcome: a strong result; only the most favourable model estimates are above this level.
These are model reference levels, not guarantees.
Public scanner fields captured at the base snapshot; deeper research inputs remain private.
Snapshot
What was captured at the base
Structure
How price is behaving
Risk and context
What may change the read
Base framework for context and outcome tracking. These are not trading instructions.
Tracking results
Observed daily-bar ranges are retrospective measurements, not targets, stops, or trading instructions.
Tryding Review
Five AI analytical agents reading the same evidence; disagreement stays visible.
“The broad indexes were positive, but the day was not one-way. Rates and the dollar were firmer, volatility edged higher, and the commodity picture was mixed. That is useful context; it does not make any issuer’s thesis.”
Adverse-MAE means the model’s estimate of the worst interim loss from entry, not the return at the end of the period.
“The IEA’s $3.4 trillion investment projection points to a large energy buildout, while the sealed ECB headline stresses energy’s inflation pass-through. Those are different forces. And the IEA page is dated May 28, so it is background, not new October news.”
I still support Raw Try because the next company update can answer that supply question and the thesis has a clear falsifier. The auditor’s correction changes the public comparison scope, not that decision.
Broader Market Context
The day combined firm major equity benchmarks with higher Treasury yields and a firmer dollar. Oil eased in the captured market snapshot, while IEA reporting described recovering crude exports alongside continuing refined-product constraints. The intraday breadth proxy leaned positive, but it preceded the later market snapshot and its end-of-day layer was unavailable. These readings describe the backdrop; they do not establish an issuer-level cause or commercial outcome for ALVO.
The sealed market snapshot was captured at 2026-10-05T16:54:40.710669Z and marked complete across seven rows. The S&P 500 changed by +0.63%, the Nasdaq 100 by +0.66%, and the Russell 2000 by +0.63%. The VIX level was 15.51, with a reported change of +1.31%. The U.S. 10-year yield level was 5.334%, with a reported change of +5.70 basis points; DXY was 102.244, with a reported change of +0.31%. Gold and WTI were shown at $4,158.50 and $90.04, with changes of −0.09% and −1.17%, respectively. These are captured levels and changes, not a claim about the later close. A separate Reuters report on October 5 described record-setting U.S. equities alongside firmer Treasury yields and the dollar, while oil prices eased. The IEA’s October 2 energy-security update described recovery in crude exports from the Middle East while refined-product flows, including diesel, remained constrained. That distinction matters: crude supply and the availability of processed fuels are different parts of the energy chain. The IEA’s May 28 projection of $3.4 trillion in global energy investment for 2026 is an annual projection, not a one-day investment change or an October 5 issuer catalyst. The intraday breadth proxy was captured at 2026-10-05T16:35:20.600958Z and had complete fresh-quote coverage for its sample. It leaned positive, which suggests the gains were shared across more names in that sample; it is not the same observation as the later market snapshot. The end-of-day breadth layer was unavailable. The snapshot itself preceded the recovery cutoff by about 26 minutes. Together, these sources provide a complete, bounded account of the material day context while leaving the later close and end-of-day breadth unresolved. Nothing in this context establishes a causal link to Alvotech’s capacity event or proves entry into U.S. commercial supply.
Sources consulted: International Energy Agency
Coffee conversation
“The sealed market snapshot at 16:54Z shows the S&P 500 up 0.63%, the Nasdaq 100 up 0.66%, and the Russell 2000 up 0.63%. The broad benchmarks were firm in that captured window.”
“Reuters also reported record-setting U.S. equities, with Treasury yields and the dollar firmer while oil eased. Its report is an earlier view of the session, so it complements the snapshot rather than sharing its exact capture time.”
“Keep the yield’s level separate from its move: it was 5.334%, with a reported increase of 5.70 basis points. One basis point is 0.01 percentage point, so that change is 0.057 percentage point, not a 5.70% yield.”
“The VIX level was 15.51 and its reported change was +1.31%. The supplied read describes volatility as contained, but the increase still shows that a firm equity session did not mean every risk measure moved in the same direction.”
“Breadth means how widely a market move is shared across stocks. The earlier intraday proxy leaned positive with complete fresh-quote coverage in its sample, but its end-of-day layer was unavailable, so it cannot tell us how the whole session finished.”
“The commodity row is mixed: gold was at $4,158.50 with a −0.09% change, and WTI was at $90.04 with a −1.17% change. The dollar figures are levels; the percentages are the reported moves.”
“The IEA’s October 2 update adds an energy-supply distinction: crude exports had recovered, while refined products such as diesel remained constrained. Different stages of the supply chain can have different conditions.”
“So easing crude prices do not by themselves establish that fuel supply is fully normal. The IEA item describes separate flows; it does not show that either one caused a particular company’s share move.”
“The IEA’s $3.4 trillion figure is its projection for total global energy investment in 2026, published in May. It is an annual forecast, not money invested that day or a fresh October 5 trigger.”
“That distinction keeps the energy story in its proper place. For Alvotech, the sealed case asks whether added capacity enters U.S. commercial supply; these broad energy sources do not answer that company-specific question.”
“The snapshot was complete when captured, but it was about 26 minutes before the recovery cutoff. It is a useful session reading, not a closing-market record.”
“The combination is more informative than a single headline: equity benchmarks advanced while yields and the dollar also strengthened, and the energy evidence remained mixed across crude and refined products.”
“The sources answer different questions: the sealed market rows give levels and changes at their capture time; the IEA gives an energy-flow update; Reuters reports the broader session. None supplies a company-level causal bridge to Alvotech.”
“That leaves a clear day-level picture: firm equity benchmarks with rate, currency, and energy crosscurrents. The broader setting helps readers place the publication, while commercial supply still needs company-specific evidence.”
Timeline
ALVO's tracked loss widened another 1.36 points to 9.44% as shares fell 3.42% on 0.43 times average volume and stayed below the session's volume-weighted average price; its twenty-session lead over Healthcare narrowed to 6.47 points. The active model leaves a broad, near-even range, and the packet still does not show Reykjavik SIMLANDI capacity entering U.S. commercial supply.
ALVO session-2 tracked loss widened 0.72 points to -6.40% after shares fell 4.72% to the session low on below-average volume. Its 20-session lead over XLV remains positive at 10.94 points, down from 13.38 in the last note. A new LOTTE agreement covers a Syracuse facility and multiple biosimilars, but does not show that the separately approved Reykjavik SIMLANDI capacity has entered U.S. commercial supply.
ALVO's tracked loss widened 0.96 points to 3.20% from yesterday and now sits 3.20 points below the initial panel baseline. The $6.11 capture was flat early and only 0.16% above VWAP; its 17.46-point 20-session lead over Health Care remains intact. The evidence still does not show FDA-approved capacity entering U.S. commercial supply, and the active model leaves a wide, near-even range.
Panel thesis: FDA approval for added U.S. manufacturing capacity for SIMLANDI creates a testable supply thesis: subsequent company evidence can show whether that capacity enters U.S. commercial supply. The review data does not establish sales or a durable 15-session path. Invalidation boundary: The thesis is materially weakened if company evidence does not show the added capacity entering U.S. commercial supply, or if subsequent regular-session observations show continued relative deterioration versus XLV.
Panel comparison
Selected candidate versus the alternatives retained from the panel comparison.
Latest display-only snapshot · Oct 9, 2026 · 10:49 NASDAQGM
Since base -9.37% · Today -0.18% · Since prior -0.18% · Relative volume 0.1 · RSI 45.67 · EMA 5.78 > 5.63 > 5.11 · VWAP below -0.29% · 52-week high 62.60% · As of Oct 9, 2026 · 10:06 NASDAQGM
Since base +0.25% · Today +0.36% · Since prior 0.00% · Relative volume 1.31 · RSI 58.95 · EMA 140.89 > 141.31 > 144.13 · VWAP above · 52-week high 67.01% · As of Oct 5, 2026 · 17:19 NASDAQGM
Since base -1.47% · Since prior 0.00% · Relative volume 0.58 · RSI 66.43 · EMA 7.72 > 7.81 > 7.94 · VWAP above · 52-week high 74.61% · As of Oct 5, 2026 · 16:15 NASDAQGM
Since base -3.39% · Today -3.74% · Since prior 0.00% · Relative volume 8.98 · RSI 73.26 · EMA 60.42 > 59.46 > 58.94 · VWAP below · 52-week high 81.21% · As of Oct 5, 2026 · 17:19 NASDAQGM
Since base -0.74% · Today +0.25% · Since prior 0.00% · Relative volume 0.34 · RSI 56.97 · EMA 1159.36 > 1161.71 > 1168.94 · VWAP above · 52-week high 89.42% · As of Oct 5, 2026 · 17:07 NASDAQGM
Company dossier
History, curiosities & sources

Selected facts and links behind the public profile.
Company description
Alvotech is an Iceland-founded biotechnology company focused on developing and manufacturing biosimilar medicines. Its integrated model spans research and development, manufacturing, and fill-and-finish, with commercial partners helping bring products to different markets.
History
- Alvotech was founded in 2013 to develop and manufacture biosimilar medicines.
- In 2016, it opened a 13,000-square-metre facility at the University of Iceland Science Park in Reykjavík, with filling and quality-control capabilities.
- Its business combination was completed on June 15, 2022, and its shares began trading on Nasdaq the following day.
- On December 8, 2022, Alvotech shares began trading on the Nasdaq Iceland Main Market; its U.S. Nasdaq listing continued.
Curiosities
- Alvotech describes a biosimilar as highly similar to an already approved reference biologic, with no clinically meaningful differences.
- The company describes its operating approach as spanning research and development through fill-and-finish, and says it uses single-use manufacturing technology.
- Alvotech says its commercial arrangements are market-specific and that Reykjavík’s local energy supply is almost entirely renewable.