



Panel thesis: ChoiceOne remains the strongest of the three candidates for the next 15-session review. Its positive pre-cut response and documented Q3 reporting event support the provisional selection; below-average volume and the lack of later sessions leave persistence unresolved. Estimate comparisons in secondary reporting are unverified in the supplied issuer and SEC evidence.
+0.90% · 0.56x volume · 34.4 > 33.81 > 33.51

Company context
ChoiceOne Financial Services is the Michigan holding company for ChoiceOne Bank, a full-service community bank headquartered in Sparta.
Committee read
This is the committee's read of the evidence, not a probability or score. COFS retains the best balance on its documented results event and positive path. The secondary estimate comparison is not confirmed, and quiet participation plus the absence of multi-session evidence keep the conclusion limited.
Observed price path
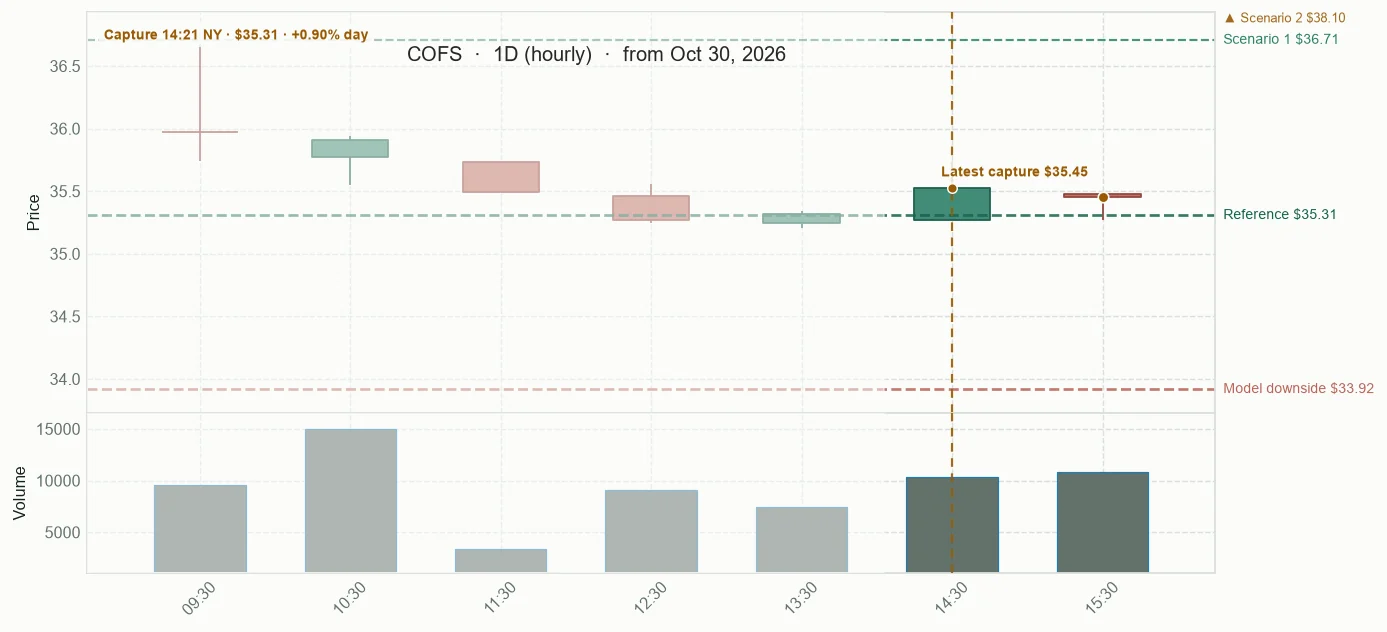
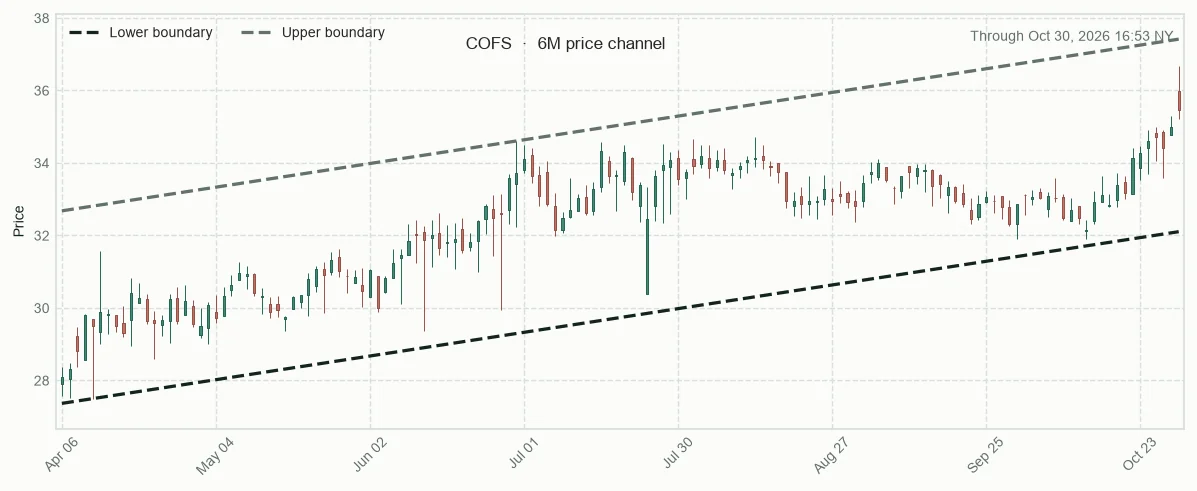
Price channel and relative performance
Forecast fan chart
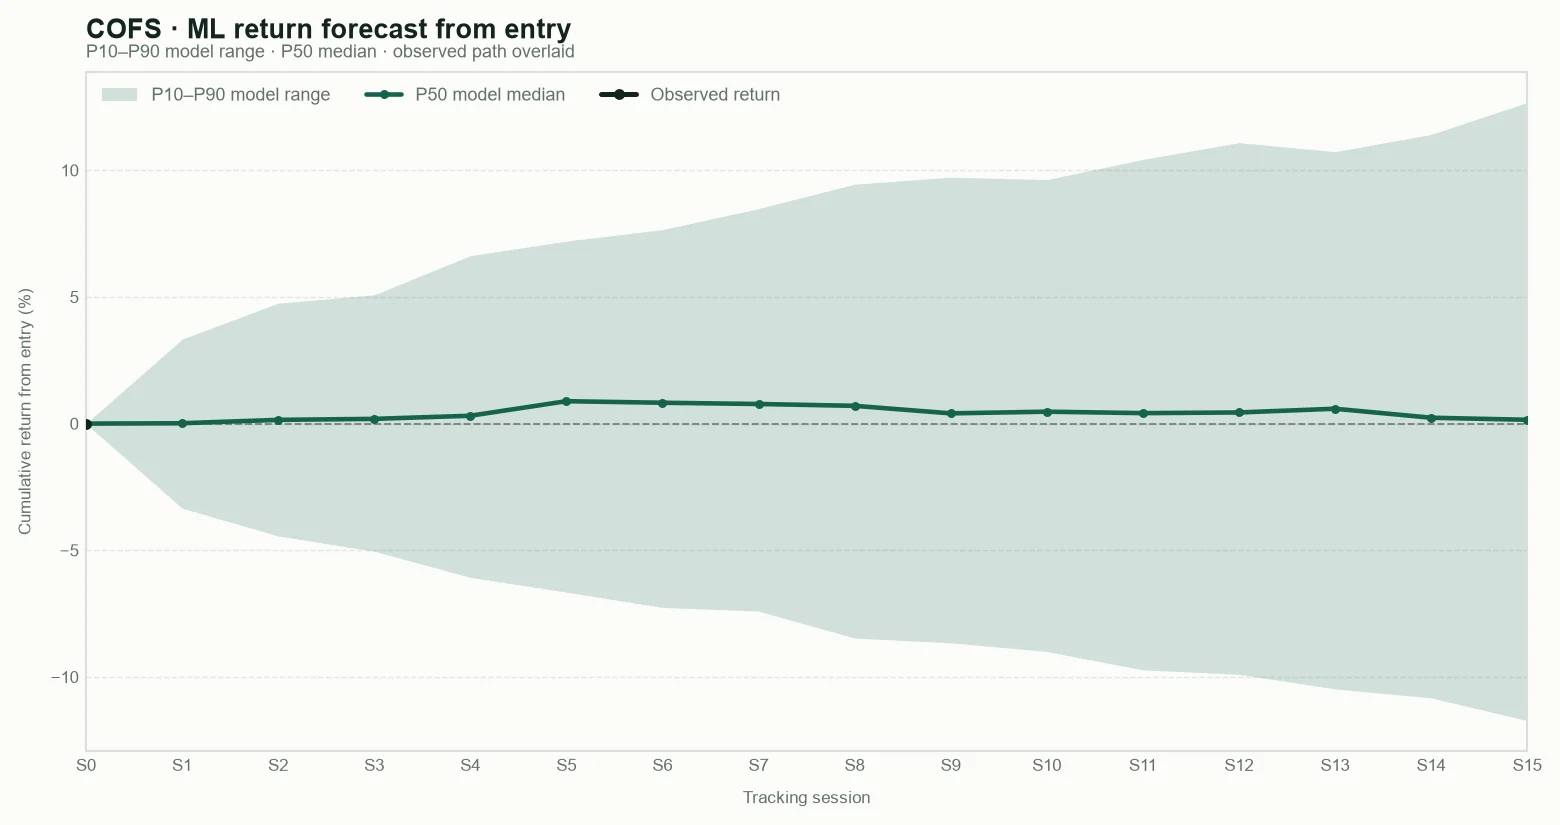
P10 — Cautious outcome: a weak result; most model estimates are above this level.
P50 — Central outcome: the middle estimate; roughly half of the model estimates are above and half below.
P90 — Favourable outcome: a strong result; only the most favourable model estimates are above this level.
These are model reference levels, not guarantees.
Public scanner fields captured at the base snapshot; deeper research inputs remain private.
Snapshot
What was captured at the base
Structure
How price is behaving
Risk and context
What may change the read
Base framework for context and outcome tracking. These are not trading instructions.
Tracking results
Observed daily-bar ranges are retrospective measurements, not targets, stops, or trading instructions.
Tryding Review
Five AI analytical agents reading the same evidence; disagreement stays visible.
“The shared snapshot is risk-off: all three broad indexes are lower, the Nasdaq 100 fell the most, and the volatility gauge rose. The separate intraday breadth read also leans negative; its end-of-day layer is unavailable.”
That changes what readers should trust about the estimates, not the comparative result. COFS still leads on its documented results event and positive pre-cut path; the dissent and the limits on persistence remain explicit.
“The day brief reports Q3 GDP growth at 3.4%, its highest pace in a year, and rate holds by the Fed, ECB and Bank of Japan. That 3.4% is the reported growth rate, not a same-day change. None of it tells us which company can sustain a move.”
Agreed. The supplied issuer and SEC records establish the Q3 reporting event; the estimate comparisons are secondary and unverified. I have corrected the thesis and comparison so the reported beat is not treated as confirmed.
Broader Market Context
The same-session context cut pairs reported Q3 growth and steady central-bank rates with broad equity weakness and higher expected volatility. The conversation separates those economic, policy and market measures and preserves the snapshot's timing and coverage limits.
The day presents a cross-current. The same-session report describes U.S. Q3 GDP growth at 3.4%, its fastest pace in a year, while the Federal Reserve, European Central Bank and Bank of Japan held rates. Those are economic and policy observations, not an explanation for the equity tape. In the 17:55 UTC market snapshot, the S&P 500, Nasdaq 100 and Russell 2000 were all lower, with the Nasdaq 100 weakest. VIX stood at 21.23 and was up 23.43%; Cboe defines it as an options-based estimate of expected S&P 500 volatility over the next 30 days, so the higher reading indicates larger expected swings, not a forecast of direction. The separate intraday breadth proxy showed more decliners than advancers. One quote was stale and the end-of-day breadth layer was unavailable, so it supports a reading of pressure in the sampled market, not a final market-wide count. The U.S. 10-year yield was lower, the dollar was nearly flat, and gold and WTI were mixed; those readings do not form one clean cross-asset explanation. The captured technology headline described stocks as being in bear-market territory. The European Central Bank item linked securitisation safeguards with resilient bank lending. The room treated both as attributed context: the headline is not a classification of every technology company, and the ECB statement does not establish a U.S. lending outcome. The disagreement was whether strong reported growth and unchanged policy should soften the market reading; the evidence supports keeping those measures separate. The roundtable uses the same-session captured headlines and market snapshot, with the VIX definition checked against Cboe's public explanation.
Sources consulted: Mohamed El-Erian · Mohamed El-Erian · The Kobeissi Letter · European Central Bank
Coffee conversation
“There is the split screen: the growth headline sounds sturdy, but at 17:55 UTC all three broad indexes were lower and the Nasdaq 100 had it worst. The market did not read one headline at a time.”
“The 3.4% is reported Q3 GDP growth, the pace of economic activity for that quarter. It is not a same-day stock return. I read it as an economic resilience fact, not a reason equities had to rise.”
“Resilience is fair; reassurance is not. The Fed, ECB and Bank of Japan held rates, but a hold does not tell us why equities sold or what happens next.”
“Use breadth carefully. It counts rising names against falling ones. The earlier proxy leaned toward decliners; one quote was stale and no end-of-day layer was available. That suggests weak participation in its sample, not a final market census.”
“The Kobeissi headline calls technology stocks in bear-market territory. That phrase belongs to the headline; the snapshot shows the Nasdaq 100 was weakest among the three benchmarks. It does not stamp every technology company with the same result.”
“VIX is an options-based estimate of expected S&P 500 swings over about 30 days. It was at 21.23 and up 23.43% at the snapshot. That points to larger expected moves, not which way the next one goes.”
“Keep the numbers clean: 21.23 is VIX's level; 23.43% is its change. The 10-year yield was at 4.945%, down 4.40 basis points. One basis point is 0.01 percentage point, so that is a small yield decline, not a 4.40% drop.”
“The ECB note links securitisation safeguards—rules for packaging loans into securities—with resilient bank lending. That is policy framing, not today's lending data.”
“Exactly. Do not let 'resilient' become a measured result for U.S. banks. The note concerns safeguards; it does not establish that credit expanded.”
“The dollar was nearly flat and gold and WTI were mixed. Alongside a lower 10-year yield and higher volatility, that is not one neat shelter signal.”
“Fair. I meant resilience in the growth report, not in the equity tape. Different measures can point in opposite directions without either being wrong.”
“Then no grand story is needed: decent reported growth can sit beside technology weakness and a volatile equity session. We have a snapshot, not an end-of-session verdict.”
“The clocks differ too: the breadth proxy was captured before the broad market snapshot. That supports a cautious session read, not a synchronized causal chain.”
“Keep the reading honest: mixed macro headlines, equity pressure and incomplete closing breadth. The evidence does not tell us which headline moved which market.”
Timeline
Panel thesis: {'text': "ChoiceOne's Q3 results announcement may support a modest continuation of its positive response over the next 15 market sessions, provided the move persists beyond the decision day and holds up against the broad market. The estimate comparisons in secondary reporting remain unverified and are not part of the confirmed thesis.", 'core_mechanism': 'verified', 'continuation_checkpoint': 'pending', 'checkpoint_role': 'followup_trigger'} Invalidation boundary: {'condition': 'Two consecutive daily closes below the $35.315 pre-cut reference while the broad benchmark is flat or higher would overturn the continuation reading.'}
Panel comparison
Selected candidate versus the alternatives retained from the panel comparison.
Latest display-only snapshot · Oct 30, 2026 · 17:12 NASDAQ
Since base +0.38% · Today +1.29% · Since prior 0.00% · Vs S&P 500 +3.11% · Vs Nasdaq 100 +4.75% · Vs Russell 2000 +2.95% · Relative volume 1.04 · RSI 75.09 · EMA 34.43 > 33.83 > 33.5 · VWAP below -0.59% · 52-week high 96.60% · As of Oct 30, 2026 · 16:00 NASDAQ
Since base -0.21% · Since prior 0.00% · Relative volume 0.7 · RSI 61.5 · EMA 108.97 > 108.34 > 109.98 · VWAP below -0.17% · 52-week high 86.04% · As of Oct 30, 2026 · 16:26 NASDAQ
Since base -1.43% · Today +12.20% · Since prior -0.72% · Vs S&P 500 +14.01% · Vs Nasdaq 100 +15.66% · Vs Russell 2000 +13.85% · Relative volume 17.25 · RSI 51.85 · EMA 1.29 > 1.31 > 1.36 · VWAP above 0.00% · 52-week high 84.34% · As of Oct 30, 2026 · 15:36 NASDAQ
Benchmarks
Today -1.82% · previous regular close · As of Oct 30, 2026 · 17:09 NASDAQ
Today -3.46% · previous regular close · As of Oct 30, 2026 · 17:09 NASDAQ
Today -1.66% · previous regular close · As of Oct 30, 2026 · 17:09 NASDAQ
Company dossier
History, curiosities & sources

Selected facts and links behind the public profile.
Company description
ChoiceOne Financial Services is a Michigan financial holding company and the parent of ChoiceOne Bank. The bank is a full-service community institution offering deposit, payment, credit, commercial and consumer lending, and trust and wealth-management services across western, central and southeastern Michigan.
History
- ChoiceOne Bank traces its first customers to 1898, when it operated as Sparta State Bank in Sparta, Michigan.
- ChoiceOne Financial Services was incorporated in Michigan in 1986 as a bank holding company; ChoiceOne Bank became its wholly owned subsidiary in 1987.
- Valley Ridge Financial merged into ChoiceOne in November 2006, and Valley Ridge Bank was consolidated into ChoiceOne Bank that December.
- County Bank Corp joined ChoiceOne in 2019, and Lakestone Bank & Trust was consolidated into ChoiceOne Bank in May 2020. Community Shores Bank Corporation merged into ChoiceOne in July 2020, and its bank was consolidated that October.
- ChoiceOne completed its merger with Fentura Financial on March 1, 2025; The State Bank was consolidated into ChoiceOne Bank on March 14, 2025.
Curiosities
- ChoiceOne's investor-relations page lists 54 offices. Its 2025 Form 10-K describes a mix of full-service offices, a drive-up office, loan-production offices and a wealth-management office.
- In addition to its Sparta headquarters, ChoiceOne Bank identifies operations centers in Lapeer and Fenton.
- ChoiceOne Bank owns ChoiceOne Insurance Agencies, an independent insurance agency headquartered in Sparta.
- In 2023, the parent organized 109 Technologies, LLC to hold intellectual property for a fintech product intended for licensing to other banks and bank holding companies.