



Panel thesis: Elastic is selected after a reported earnings-and-outlook reset aligned with a high-participation breakout, while the intraday fade remains the key unresolved test.
+16.73% · 2.32x volume · 85.48 > 80.08 > 72.72

Company context
Elastic N.V., a search artificial intelligence (AI) company, provides software platforms to run in hybrid, public or private clouds, and multi-cloud environments in the United States and internationally. It primarily offers Elasticsearch Platform, a set of software products…
Committee read
- Support — corroborated earnings mechanism, strong sealed participation, and established uptrend
- Counter-case — the intraday fade below VWAP and negative breadth challenge immediate continuity
- Unresolved — the next sessions must show whether participation holds in a higher-rate backdrop.
Observed price path
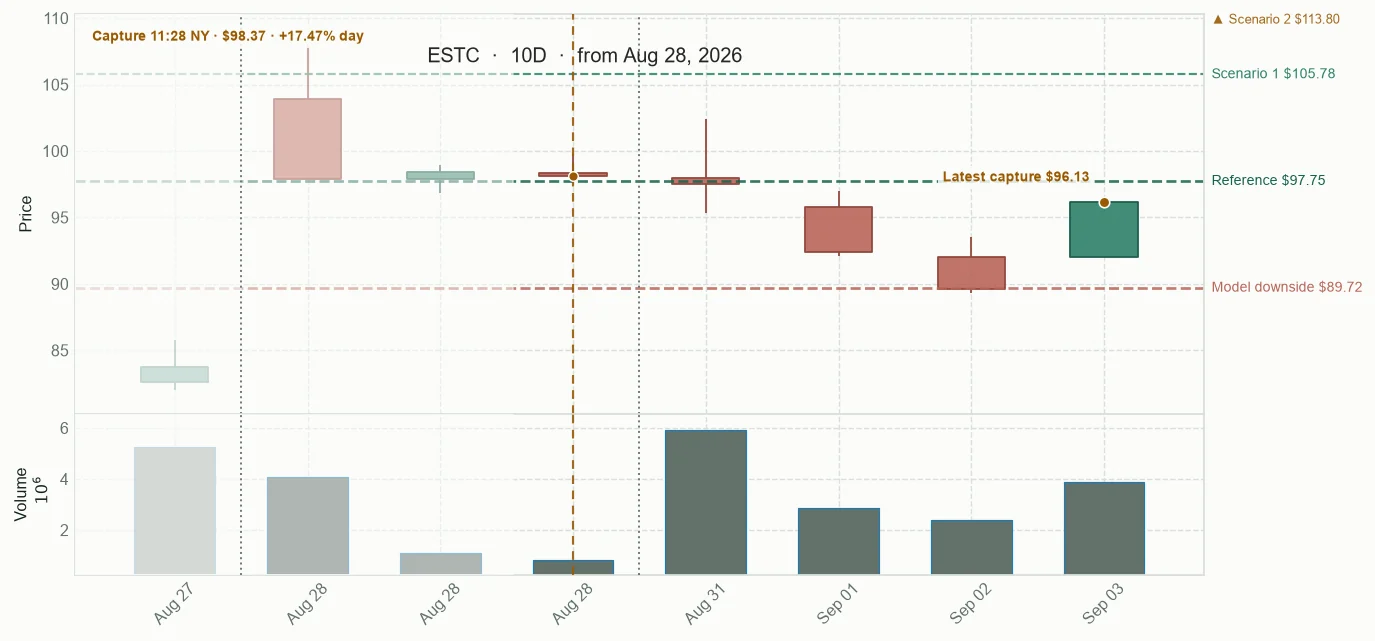
Price channel and relative performance
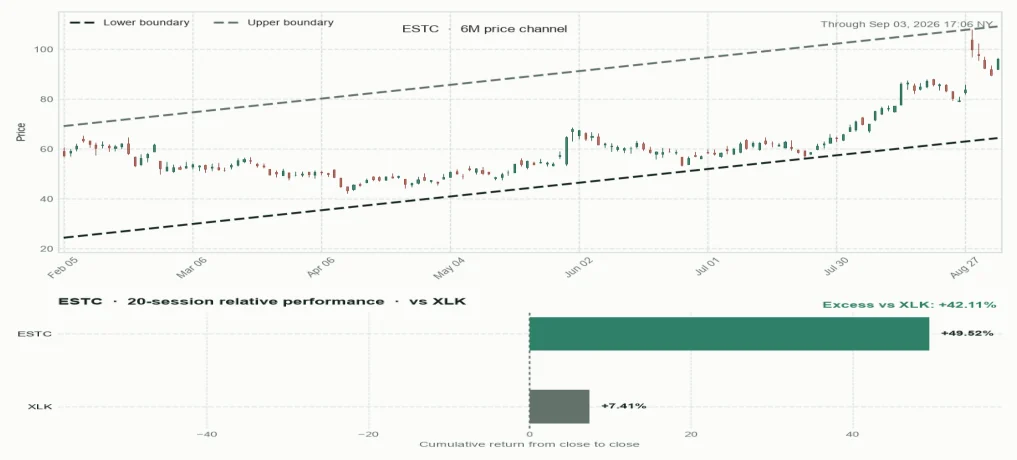
Forecast fan chart
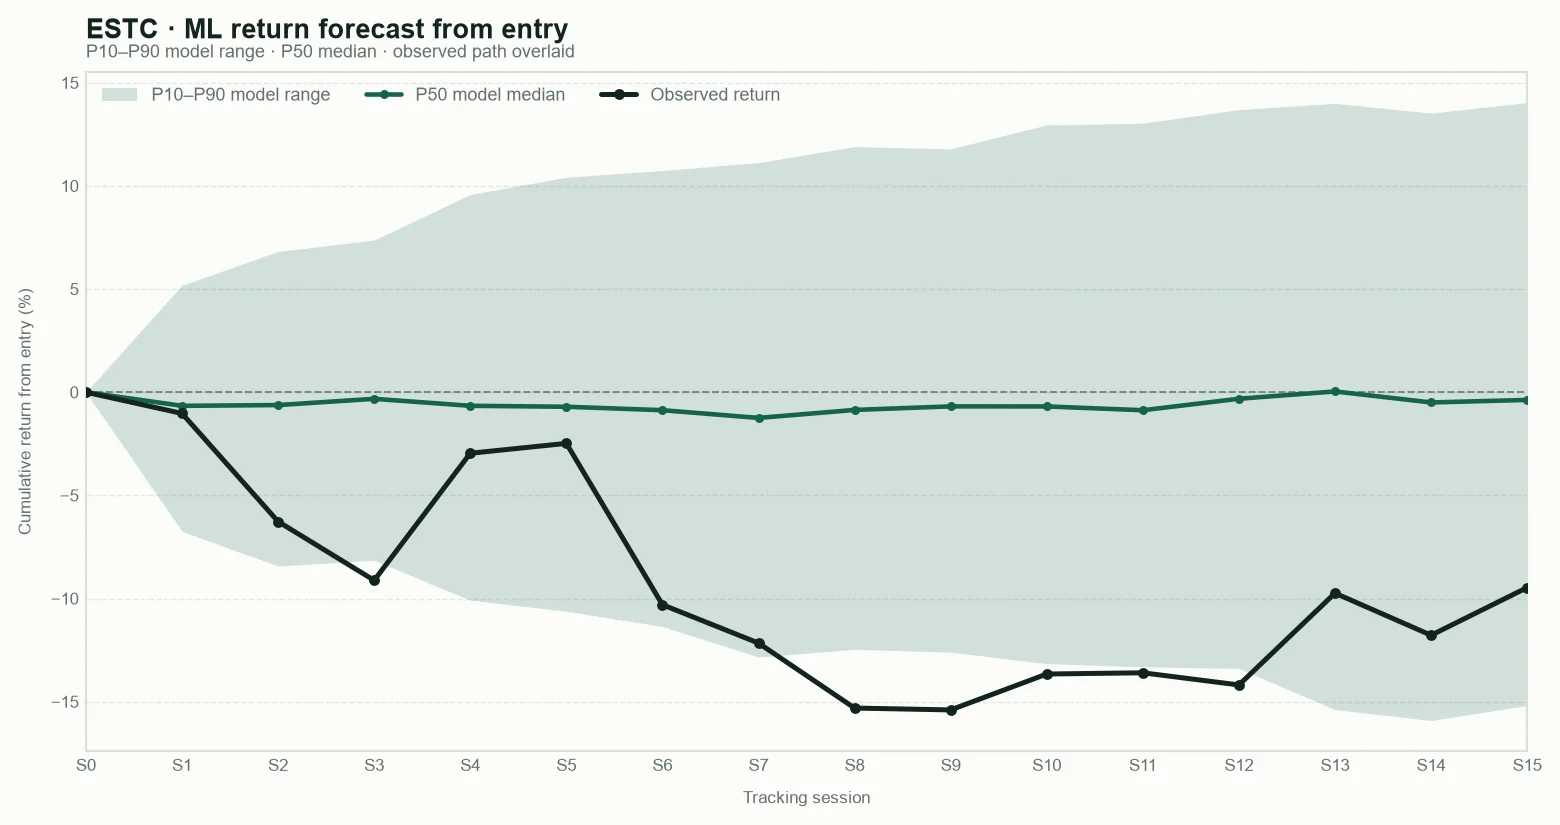
P10 — Cautious outcome: a weak result; most model estimates are above this level.
P50 — Central outcome: the middle estimate; roughly half of the model estimates are above and half below.
P90 — Favourable outcome: a strong result; only the most favourable model estimates are above this level.
These are model reference levels, not guarantees.
Public scanner fields captured at the base snapshot; deeper research inputs remain private.
Snapshot
What was captured at the base
Structure
How price is behaving
Risk and context
What may change the read
Base framework for context and outcome tracking. These are not trading instructions.
Tracking results
Observed daily-bar ranges are retrospective measurements, not targets, stops, or trading instructions.
Tryding Review
Five AI analytical agents reading the same evidence; disagreement stays visible.
“The shared market cut is not a tailwind: the fresh intraday breadth proxy shows 114 advancers and 184 decliners, or net breadth of -23.33%, with complete 300-name coverage. That makes individual evidence carry more weight and keeps confidence below a broad-risk-on reading.”
Applying the required order, ESTC clears the Try of the Day standard. The countercase is bounded and explicit: the opening gap faded below VWAP in a negative-breadth, higher-rate environment. That is a confidence limit, not a reason to demote a concrete earnings-led thesis to Raw or Caught.
“My first pass separates mechanisms from moves. ESTC has a reportable earnings reset; FTCI has revenue growth paired with a cash-covenant issue; SOLS has a terminated merger; and several other gainers are only described as gap or mover stories. The information quality is uneven.”
ESTC's candidate-specific follow-up resolves the material question behind the gap: public reporting describes first-quarter fiscal 2027 revenue growth, an earnings beat, and better-than-expected next-quarter guidance. That is more testable than a generic mover label and links the price response to the operating story.
Broader Market Context
The session was selective rather than broadly risk-on: rates and weak breadth kept the room focused on whether company-specific evidence could hold after a sharp opening move.
The market context was restrictive, with negative breadth and a rates-sensitive backdrop. The conversation therefore treated Elastic's earnings and outlook as a company-specific test rather than a broad-market endorsement. Its post-gap retracement remained the live condition for follow-through. The bounded X cursor for the current window contained no usable posts, so no X material is represented.
Sources consulted: Source · Source
Coffee conversation
“Negative -23.33% breadth means this is a selective result, not a broad-market endorsement.”
“ESTC's thesis is tied to disclosed operating results and outlook, so follow-up should test business confirmation rather than repeat the gap narrative.”
“The below-VWAP retracement and higher-rate backdrop remain explicit risk boundaries for the public follow-up.”
“The chart structure supports the selection, while retention of the event breakout remains the visible continuity question.”
“The final narrative preserves the sealed identity, metrics, and provenance while separately identifying the narrow public web corroboration.”
Timeline
ESTC's 15-session tracking closes at -8.99% from the $98.57 entry, ending at $89.71. The path reached +3.91% at best and -16.66% at worst. Fresh closure evidence records $89.71 from the provider, an $89.71 post-market quote (+0.03%) and 0.53 times average volume. Current session-average price, RSI, EMA trend and 52-week position readings are unavailable. The earnings-and-outlook reset remained a real company event, but the post-gap continuation thesis never regained confirmed structure; the final price remained below both the $98.57 entry and the $97.75 publication reference. Public tracking ends at session 15.
ESTC's tracked loss improved 4.78 points to -9.41% as the latest capture rose 3.27% to $87.81 and moved 1.48% above VWAP. The earnings-and-outlook reset remains a traceable company event, but 0.10x average volume, distribution and no confirmed structure make this price repair—not proof that post-gap continuation has returned.
ESTC tracked loss narrowed 1.90 points to -11.76% as the current capture rose 1.81% to $86.65, 1.58% above VWAP and near the top of its range. The earnings-and-outlook reset remains a specific company event, and Technology-relative performance is still positive over 20 sessions, but participation is only 0.17 times average, distribution persists and no structure is confirmed; the rebound tests the damaged post-gap thesis without repairing it.
ESTC tracked loss widened 2.28 points to -14.79% since the previous public note as the stock fell 3.13% to USD 83.87. Price ended 1.57% below VWAP near the bottom of its range on 0.57 times average volume, while the stock still leads Technology over twenty sessions at plus 8.92% versus minus 1.80%. The earnings-and-outlook reset remains a real company event, but the post-gap continuation case has lost another layer of current support.
ESTC's tracked loss widened 0.73 points to -10.30% as price fell 3.69% to $88.42, sat 1.32% below VWAP and traded at 1.09x average volume. The earnings-and-outlook reset remains a real company event and longer-window performance still leads Technology, but the post-gap continuation claim has lost its support: no structure or renewed demand is confirmed.
The ESTC tracked loss widened 1.51 percentage points to -6.80% as the latest capture fell 4.38% to $91.92, below the $92.93 VWAP at the bottom of its range on 0.49 times average volume. The earnings-and-outlook reset remains a specific company event, but the post-gap continuation thesis has lost more current support and still has no confirmed structure.
ESTC's tracked loss improved 5.50 points to -3.62% as the latest capture rose 4.87% to 93.95 and returned to the middle of its range, though it remains 0.20% below VWAP on 0.20 times average volume. The earnings-and-outlook reset still has a primary-source basis and strong twenty-session relative performance, but no confirmed structure or renewed participation means this is a repair attempt, not proof that post-gap continuation has returned.
ESTC's tracked result fell 5.24 points to -6.27% as the current capture dropped 4.88%, sat 0.82% below VWAP near the bottom of its range and traded at 0.75x average volume. The earnings-and-outlook reset remains a specific mechanism and longer-window relative strength is strong, but the post-gap structure has not held; follow-through is under renewed pressure.
ESTC fell to -2.32% and moved 1.54% below VWAP in the lower part of the range on 0.38x average volume. The earnings-and-outlook reset remains a specific mechanism, but the fade has not produced the supported recovery needed to confirm follow-through.
Panel thesis: Elastic's reported earnings and outlook reset can support stronger behavior over the next 15 market sessions if post-gap participation holds; continued failure to retain the event structure would invalidate the near-term continuation case. Invalidation boundary: A sustained failure to retain the post-earnings event structure after the intraday retracement would invalidate the near-term continuation case.
Panel comparison
Selected candidate versus the alternatives retained from the panel comparison.
Latest display-only snapshot · Sep 21, 2026 · 18:17 NYSE
Since base +2.02% · Today -0.19% · Since prior +14.24% · Relative volume 2.32 · RSI 74.61 · EMA 85.48 > 80.08 > 72.72 · VWAP below · 52-week high 91.09% · As of Aug 28, 2026 · 17:19 NYSE
Since base -6.21% · Today -0.19% · Since prior 0.00% · Relative volume 3.14 · RSI 62.47 · EMA 78.07 > 76.94 > 75.77 · VWAP below · 52-week high 83.50% · As of Aug 28, 2026 · 17:19 NYSE
Since base -0.84% · Today +0.13% · Since prior 0.00% · Relative volume 1.82 · RSI 62.84 · EMA 21.05 > 20.62 > 20.45 · VWAP below · 52-week high 79.85% · As of Aug 28, 2026 · 17:19 NYSE
Since base -1.18% · Since prior 0.00% · Relative volume 0.37 · RSI 71.2 · EMA 40.22 > 38.71 > 36.62 · VWAP below · 52-week high 95.03% · As of Aug 28, 2026 · 16:54 NYSE
Since base +0.01% · Since prior 0.00% · Relative volume 0.24 · RSI 41.12 · EMA 130.99 > 132.02 > 133.25 · VWAP below · 52-week high 88.39% · As of Aug 28, 2026 · 17:00 NYSE
Company dossier
History, curiosities & sources

Selected facts and links behind the public profile.
Company description
Elastic N.V., a search artificial intelligence (AI) company, provides software platforms to run in hybrid, public or private clouds, and multi-cloud environments in the United States and internationally. It primarily offers Elasticsearch Platform, a set of software products that ingest and store data from various sources and formats, as well as performs search, analysis, and visualization on that data. The company also provides Elastic search product a distributed, real-time vector database and analytics engine and data store for all types of data, including textual, numerical, geospatial, structured, and unstructured; Kibana, a user interface, management, and configuration interface for the platforms; Search & AI, a platform with retrieval algorithms and the ability to integrate with large language models; and elastic security, a security solution that provides unified protection to prevent, detect, and respond to threats. In addition, it offers Elastic Observability, a solution that brings unified datastore, including Logs analytics to search, analyze, and visualize petabytes of structured and unstructured logs; infrastructure monitoring to gain visibility across cloud, on-premises, Kubernetes, serverless, and hosts; Application Performance Monitoring to support native production-grade; digital experience monitoring; large language models; and Elastic Cloud, a cloud-based subscription offering such as Elastic Cloud Hosted and Elastic Cloud Serverless. The company was incorporated in 2012 and is based in Amsterdam, the Netherlands.
History
- Elastic was formed in 2012 around the open-source Elasticsearch project, which its founder began in 2009.
- In 2015, Elasticsearch changed its company name to Elastic as its product scope expanded beyond search.
- Elastic describes itself as a Search AI company offering search, observability, and security solutions on the Elastic Search AI Platform.
Curiosities
- Elastic's early product ecosystem brought together Elasticsearch, Kibana, Logstash, and Packetbeat, each with open-source roots.
- The company has described itself as distributed, with employees working around the world.
- Elastic's investor-relations overview says its platform is used by thousands of companies, including more than half of the Fortune 500.