



Panel thesis: Provisional Try of the Day: EAT. Reported Q1 FY2027 revenue growth, adjusted EPS and higher guidance give the earnings response a company-specific basis. The supplied record does not establish improved margins or show that the response will persist through the 15-session episode.
+14.33% · 1.56x volume · 199.21 > 199.15 > 206.53

Company context
Dallas-based casual-dining company behind Chili’s Grill & Bar and Maggiano’s Little Italy.
Committee read
This is the committee's read of the evidence, not a probability or score. The filed company event, raised outlook and captured relative path support EAT. The absent period-matched margin evidence, extension after the earnings move and wide eight-case return and adverse-excursion ranges limit the conclusion; the prepared SEC context behind the adverse-MAE output is older and not confirmed as point-in-time. These percentages express committee judgment, not calibrated odds.
Observed price path
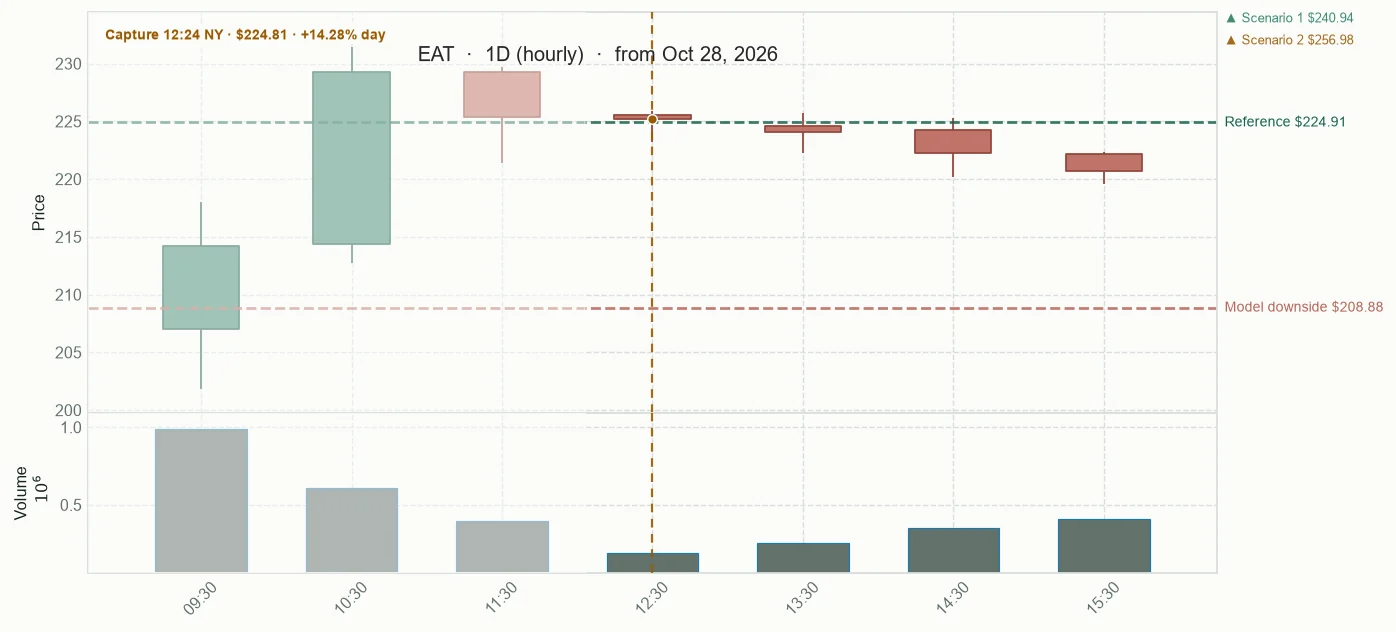
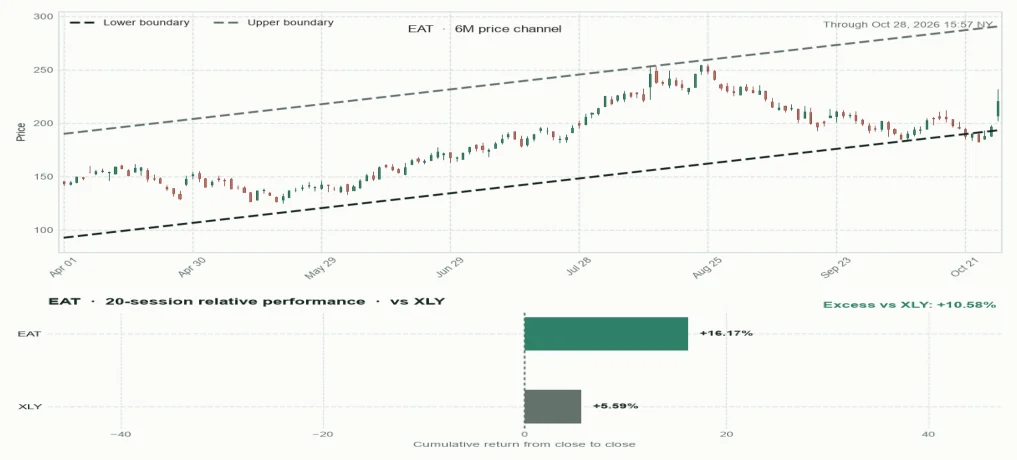
Price channel and relative performance
Forecast fan chart
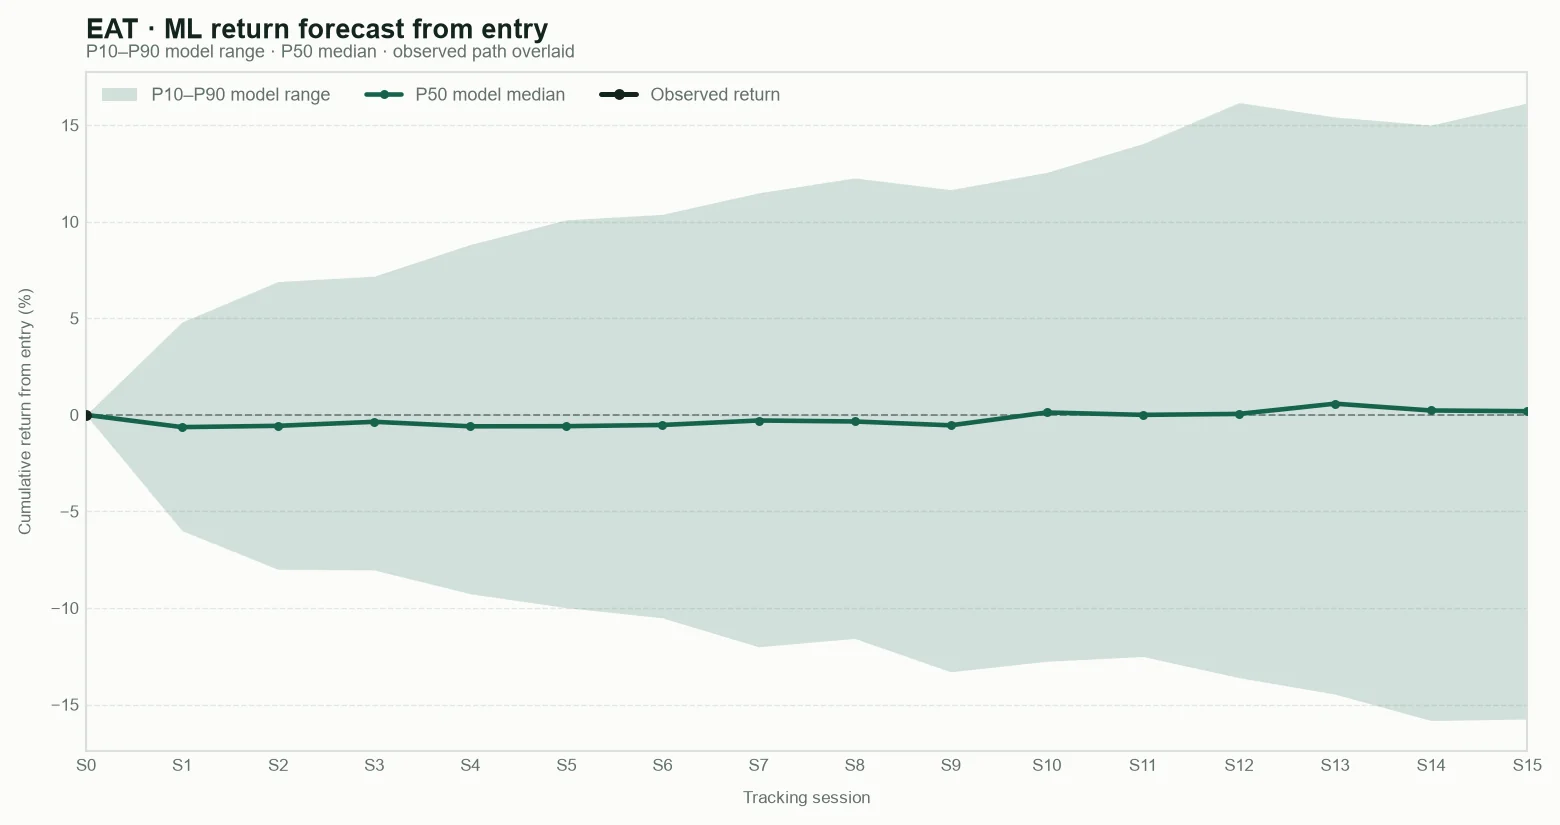
P10 — Cautious outcome: a weak result; most model estimates are above this level.
P50 — Central outcome: the middle estimate; roughly half of the model estimates are above and half below.
P90 — Favourable outcome: a strong result; only the most favourable model estimates are above this level.
These are model reference levels, not guarantees.
Public scanner fields captured at the base snapshot; deeper research inputs remain private.
Snapshot
What was captured at the base
Structure
How price is behaving
Risk and context
What may change the read
Base framework for context and outcome tracking. These are not trading instructions.
Tracking results
Observed daily-bar ranges are retrospective measurements, not targets, stops, or trading instructions.

Tryding Review
Five AI analytical agents reading the same evidence; disagreement stays visible.
“The shared picture is mildly constructive, but the index snapshot is already about forty minutes old at our cutoff. The separate participation proxy leans slightly negative, with an end-of-day layer unavailable. And the Atlanta Fed's 3.3% is a Q3 estimate, not a final GDP result. That is session context, not a candidate score.”
The four-to-one decision stays Try of the Day for EAT. The company event and captured relative path support a provisional, testable thesis; the margin claim is removed, the shortlist is narrowed, and the model’s adverse range and older SEC input remain visible limits.
“EAT has the clearest current operating mechanism: the supplied Q1 fiscal 2027 reports describe higher sales, adjusted EPS of $2.77, and a raised full-year outlook. Adjusted EPS is per-share earnings with some items excluded; the follow-up question is whether the underlying sales and margins support that outlook.”
The model’s middle S15 return estimate is about +0.19%, with P10 and P90 at about −15.75% and +16.15%; its adverse-excursion median is about −8.25%, with P10 near −18.01%. Those are broad ranges from eight comparable cases, not a target. The SEC-aware downside estimate also uses prepared September 1 financial context whose point-in-time validity is unconfirmed.
Broader Market Context
The day’s supplied snapshot showed modest gains across major indexes, but it was captured before the Federal Reserve decision and was already beyond its freshness marker at the effective cutoff. A separate intraday breadth proxy suggested mixed participation and included stale quotes; end-of-day breadth was unavailable. The Atlanta Fed’s 3.3% Q3 GDPNow figure was a model estimate, not reported GDP. The Fed then held rates while inflation remained elevated and two members preferred a hike. Household cost pressures and geopolitical energy risks add uncertainty, while neither establishes an outcome for any individual company.
The shared market snapshot was captured at 17:53:55 UTC, before the Federal Reserve announcement at 18:00 UTC. At capture, the S&P 500, Nasdaq 100 and Russell 2000 were modestly higher; the VIX was at 17.37, the 10-year Treasury yield at 5.02%, and the dollar little changed. Gold and WTI were mixed. Those are dated readings, not a post-decision market verdict, and the snapshot was older than its 15-minute freshness marker by the effective cutoff. A separate intraday breadth proxy showed mixed participation, but it is a limited sample with stale quotes; its end-of-day layer was not captured. The Atlanta Fed’s final Q3 GDPNow estimate was 3.3%. GDPNow is a running model estimate, not an official forecast or a reported GDP result; its annualized rate expresses the quarter’s pace as if it continued for a year. Later, the Federal Reserve held its target range at 3.75%–4.00%. Inflation remained elevated, two members dissented in favor of a 25-basis-point increase, and the first reported market reaction was mixed with Treasury yields higher. Separately, October consumer confidence improved as gasoline eased from September, although household costs remained elevated. Energy commentary described geopolitical escalation as a risk to oil markets while noting resilient physical flows. Together these sources describe cross-currents in growth, policy, household costs and energy; they do not establish a causal outlook for Brinker’s margins or results.
Sources consulted: Federal Reserve Bank of Atlanta
Coffee conversation
“The Atlanta Fed’s 3.3% Q3 GDPNow figure is a model estimate, not completed GDP. It annualizes the quarter’s pace—as if that pace continued for a year—so it gives a growth signal, not a final result.”
“The Fed held its target range at 3.75%–4.00%, while inflation remained elevated and two members preferred a 25-basis-point hike. That is a hold under disagreement, not a clean all-clear.”
“When we say the Fed “held,” does that mean policy is getting easier? The distinction matters when reading the market’s first reaction.”
“No. It means the target range stayed unchanged. The two votes for a hike show the committee was divided, and the initial market report described a mixed stock response with Treasury yields higher.”
“The supplied index snapshot predates that decision, so it cannot explain the post-announcement response. The separate breadth proxy suggested mixed participation, but stale quotes and the missing end-of-day layer limit how broadly we can read it.”
“Consumer confidence improved in October as gasoline eased from September, yet households still reported pressure from energy and other costs. That is relevant background for restaurant spending, but it does not establish Brinker's margins or demand.”
“Oil commentary adds another cross-current: strategists described sensitivity to geopolitical escalation, while physical flows remained resilient. That is a risk channel, not evidence that a supply disruption has occurred.”
“So the day’s backdrop combines a growth estimate with unsettled inflation and policy signals. Because the broad snapshot is pre-decision and breadth coverage is limited, it should remain context rather than a company-level conclusion.”
Timeline
Panel thesis: Brinker’s reported Q1 FY2027 revenue growth, adjusted EPS and raised FY2027 outlook provide a company-specific basis to test whether its earnings response can persist through the 15-session episode. The supplied record does not establish improved margins; that remains an open check. Invalidation boundary: A withdrawal or reduction of the raised outlook, deteriorating reported revenue or earnings, or later evidence of margin contraction would weaken the follow-through thesis.
Panel comparison
Selected candidate versus the alternatives retained from the panel comparison.
The supplied coverage reports a Q3 earnings beat and increased full-year EPS outlook; an SEC filing dated 2026-10-27 is present. · The linked scan change is +5.38% and the quote-snapshot change is +5.24%; the pre-cut trajectory ended at +5.6593776%. · RSI is 78.25 and price is 3.24 ATR above the EMA reference. · Score 2 · $119.55 · +5.38% · 1.29x volume · RSI 78.25 · EMA 111.87 > 109.4 > 109.61 · 52w 89.47% of high · VWAP above · NYSE
PPG has a specific reported event and a sustained captured advance, but its RSI and distance from the EMA reference show greater extension than EAT’s at the cut.
Open PPG chart on TradingViewSupplied earnings summaries report Q3 EPS of $0.34 versus a $0.22 estimate, sales of $1.375 billion versus $1.373 billion, and raised FY2026 sales guidance; a same-day SEC filing is present. · The recorded change is +8.57%; the pre-cut trajectory ended at +10.763978%. · The prepared SEC balance-sheet snapshot dated 2026-03-31 records $268 million cash and $5.039 billion total debt; the share price was at 98.41% of its 52-week high. · Score 7 · $19.13 · +8.57% · 2.63x volume · RSI 68.68 · EMA 17.6 > 17.25 > 17.12 · 52w 98.41% of high · VWAP above · NYSE
BLCO has a documented earnings event and a strong response, but its older balance-sheet context and proximity to the 52-week high leave a less comfortable continuation case.
Open BLCO chart on TradingViewThe supplied Q3 summary reports adjusted EPS of $6.76 versus $6.16 and sales of $7.281 billion versus $7.239 billion; a same-day SEC filing is present. · The pre-cut trajectory eased from an earlier +12.299541% change to +11.302636% at its final point. · $333.83 · 1.70x volume · RSI 66.31 · EMA 309.6 > 310.91 > 326.18 · 52w 84.74% of high · VWAP above · NYSE
JLL has a specific earnings event and a substantial positive response, but its captured path had eased by the cut. Post-cut JLL captures are excluded from this comparison.
Open JLL chart on TradingViewCompany dossier
History, curiosities & sources
Selected facts and links behind the public profile.
Company description
Brinker International, Inc. is a Dallas-based casual-dining company whose brands include Chili’s Grill & Bar and Maggiano’s Little Italy. It owns, operates or franchises more than 1,600 restaurants across 29 countries and two U.S. territories, with dine-in, takeout and delivery service.
History
- The first Chili’s opened on Greenville Avenue in Dallas in 1975.
- Norman Brinker purchased Chili’s in 1983.
- The first Maggiano’s opened in Chicago in November 1991.
- Brinker purchased Maggiano’s in 1995.
Curiosities
- The original Chili’s burger shack had 25 menu items, including beer and margaritas.
- Chili’s helped popularize fajitas and used the phonetic spelling “fa-heet-ah” on menus.
- Chili’s credits a 1986 baby-back-ribs jingle as part of its brand history.
- In 2017, Chili’s reduced its menu by 40% to focus on core items.