





Panel thesis: Flywire's reported Q3 growth, EPS beat, and higher FY2026 revenue-guidance floor give the move a company-specific basis. The pre-cut tape remained positive, but the guidance ceiling stayed below the cited estimate, price was extended, and one session cannot establish a 30-session path.
+10.89% · 1.24x volume · 19.58 > 19.04 > 18.52

Company context
Flywire provides payment services and industry-specific software for organizations in education, healthcare, travel and B2B.
Committee read
This is the committee's read of the evidence, not a probability or score. The recorded majority supports FLYW on the company-specific earnings and guidance case plus the pre-cut tape. Extension, the guidance ceiling, and limited historical adverse-MAE coverage preserve a material countercase and unresolved S1–S30 risk.
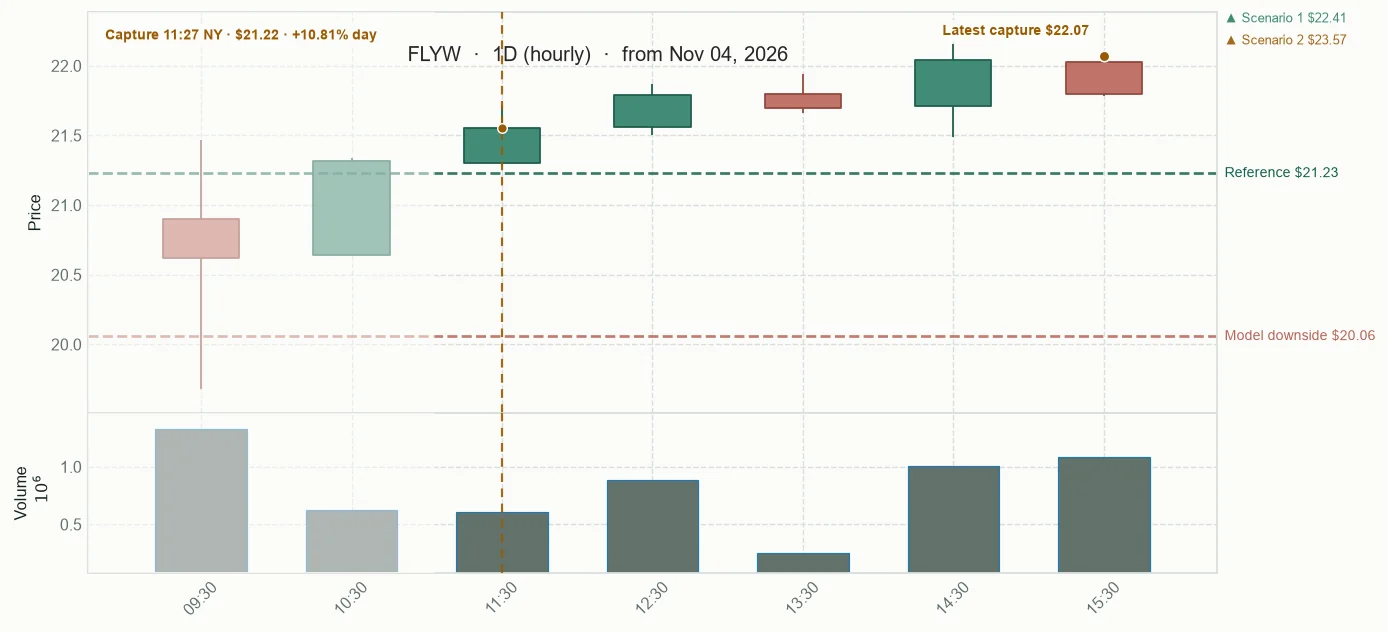
Observed price path
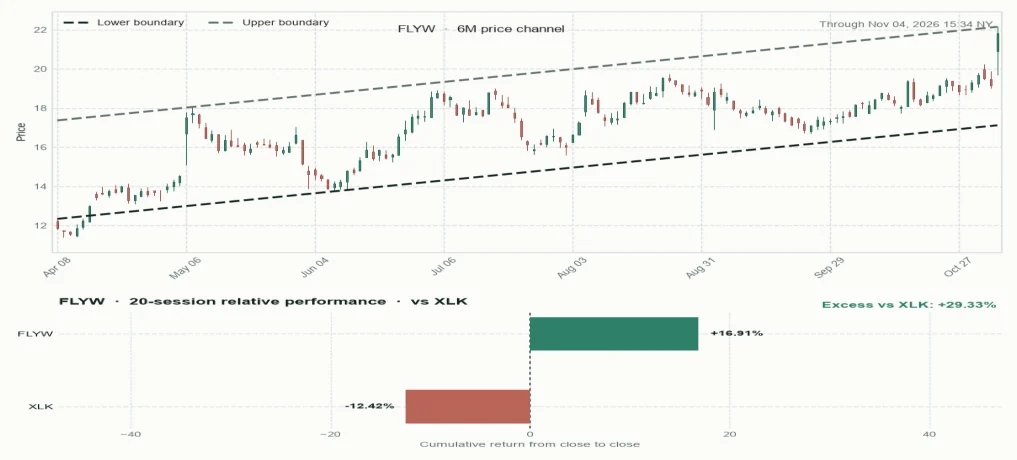
Price channel and relative performance
Forecast fan chart
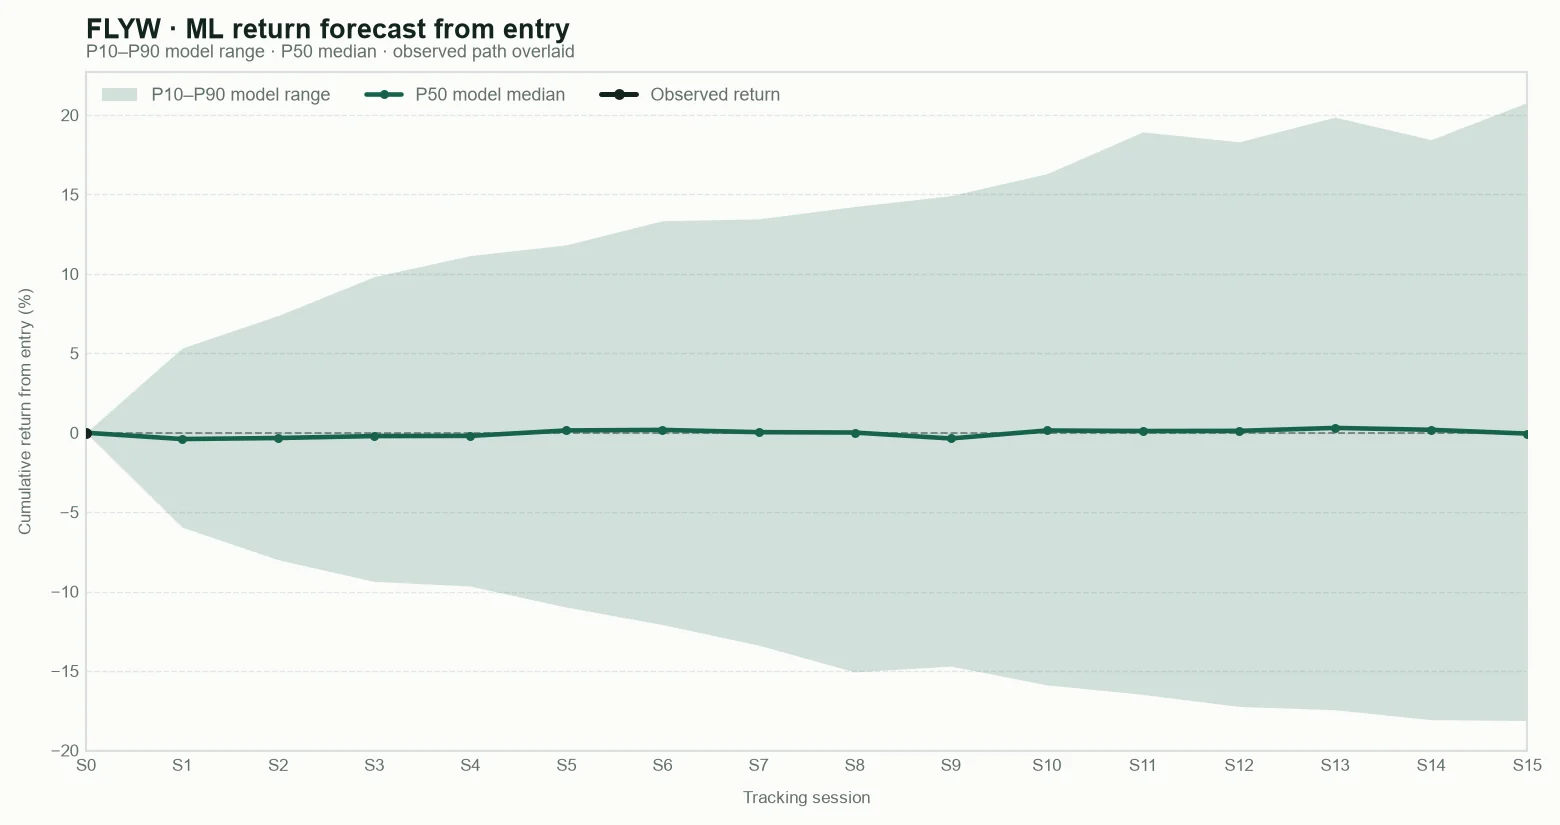
P10 — Cautious outcome: a weak result; most model estimates are above this level.
P50 — Central outcome: the middle estimate; roughly half of the model estimates are above and half below.
P90 — Favourable outcome: a strong result; only the most favourable model estimates are above this level.
These are model reference levels, not guarantees.
Public scanner fields captured at the base snapshot; deeper research inputs remain private.
Snapshot
What was captured at the base
Structure
How price is behaving
Risk and context
What may change the read
Base framework for context and outcome tracking. These are not trading instructions.
Tracking results
Observed market ranges and any recorded cash settlement values summarize past episode data, not forecasts or trading instructions.
Tryding Review
Five AI analytical agents reading the same evidence; disagreement stays visible.
“At the supplied market snapshot, the broad benchmarks were higher, volatility was lower, and rates and the dollar were softer. That is a supportive session backdrop at capture, not an explanation for any one company.”
FLYW remains provisional. Its H15 positive-return estimate is 0.501, near even; the historical adverse-MAE comparison has only eight cases, with a −14.57% P10, and the separate SEC-aware P10 is −23.02% from context-only data. These are bounded context, not a 30-session forecast.
“The clock narrows that reading. The snapshot was nearly twenty-two minutes old at our cut; the breadth proxy was older, limited to its defined sample, and has no end-of-day layer. The shared news brief is empty and invalid. We can still review the sealed cases, but we cannot fill that gap with a market story.”
The usable VEEV series ends at 18:16:33Z: its recorded change versus the prior regular close was +1.8568006%. That is a change, not the quoted price level, and it gives us no sector-relative result by the cut.
Broader Market Context
The supplied market snapshot showed a broadly supportive session amid reports of a post-midterm relief rally, but policy-sensitive sectors diverged and the breadth proxy was limited and stale by the decision cut. The session is useful context for Flywire’s reported results; it does not establish why the company grew or whether its post-results response will persist.
Public reporting described investors responding to the U.S. midterm outcome as a reduction in political uncertainty, while also weighing possible policy effects on AI, energy, healthcare, spending and oil. The supplied 17:54 UTC market snapshot showed the major U.S. benchmarks higher, VIX lower, Treasury yields and the dollar lower, and commodities mixed. These were dated observations, not causal explanations for every stock. The separate breadth proxy covered a defined 300-name sample and had no EOD layer, so it could not settle how widely the market’s move held through the close. Flywire’s reported Q3 results remain company evidence set within that broader backdrop.
Coffee conversation
“At 17:54:59Z, the supplied snapshot had the S&P 500, Nasdaq 100 and Russell 2000 higher. VIX, an options-derived gauge of expected near-term volatility, was at 16.96 with a reported session change of −18.58%. That fits a calmer risk tone, but it does not promise market direction.”
“The rally was not uniform. AP reported gains for solar and healthcare shares while AI-linked names faced policy questions. A green index day can contain different industry reactions, so the wider backdrop should stay separate from Flywire’s own operating results.”
“When we call the lower VIX a calmer risk tone, does that mean traders expected stocks to keep rising?”
“No. VIX reflects the volatility options prices imply for the near term; it is not a forecast of whether prices will rise or fall. Its lower reading describes what was priced at that snapshot, not how long the rally would last.”
“Breadth means how many names are rising versus falling in a defined group. The 17:35:10Z proxy showed 200 advancers and 99 decliners among 300 names, with one stale quote. There was no EOD layer, and the reading was about 42 minutes old at the decision cut; it cannot establish full-session participation.”
“The 10-year yield was at 4.90%; its reported daily change was −5.20 basis points. A basis point is one-hundredth of a percentage point, so that change is −0.052 percentage point. Lower yields can ease some valuation pressure, but they do not establish demand for a particular company.”
“Flywire’s release reports Q3 revenue growth of 25.1% and a higher FY2026 guidance floor. That is company-specific information occurring within a supportive session; the market rally does not explain the reported growth or prove it will continue.”
“The initial shared news cut had no validated items, while public reporting later described the election relief narrative and its policy uncertainties. Together with the snapshot’s age and missing EOD breadth, that leaves the day as bounded context rather than a verdict on Flywire’s longer path.”
Timeline
For FLYW, the first tracked session adds 3.81% from the published reference, while the latest capture rose 14.67% for the day on 3.02 times average volume and held 3.05% above VWAP. That strengthens the market response to Q3 growth and the higher FY2026 revenue floor, but the unchanged ceiling remains below the cited estimate and the price is extended, so the operating claim still needs later results.
Panel thesis: Flywire's reported Q3 growth and higher lower bound for FY2026 revenue guidance give the reaction a company-specific basis. A 30-session continuation remains defensible currently if later observations preserve the post-results response and the reported growth holds up. The unchanged guidance ceiling, which remains below the cited estimate, is a live countercase. Invalidation boundary: A completed-session close below $19.15 accompanied by continued relative weakness, or primary issuer reporting that reverses the raised guidance or reported growth, would falsify the earnings-acceptance thesis.
Panel comparison
Selected candidate versus the alternatives retained from the panel comparison.
Supplied earnings coverage reports sales of $195.3M versus $162.4M expected and raised FY2026 sales guidance to $665–685M. · The pre-cut trajectory remained positive, reaching a +6.4344754% change at 18:16:17Z. · Score 9 · $9.10 · +7.44% · 3.12x volume · RSI 65.03 · EMA 8.0 > 7.86 > 7.82 · 52w 69.12% of high · VWAP below · NasdaqGM
not_selected
Open SHLS chart on TradingViewSupplied Q3 coverage reports comparable sales growth of 3%, order intake growth of 8%, a 70-basis-point increase in adjusted EBITA margin, and reaffirmed FY outlook. · The pre-cut series reached a +9.167256% change at 18:16:04Z. · Score 4 · $30.64 · +7.66% · 1.21x volume · RSI 86.59 · EMA 27.83 > 26.72 > 26.13 · 52w 91.74% of high · VWAP above · NYSE
not_selected
Open PHG chart on TradingViewSupplied Q3 coverage reports adjusted EPS of $2.31 versus $1.56 expected and raised FY2026 EPS guidance. · The pre-cut trajectory reached a +15.766579% change at 18:16:40Z. · Score 4 · $121.15 · +15.80% · 1.37x volume · RSI 89.26 · EMA 105.53 > 99.85 > 96.83 · 52w 99.79% of high · VWAP above · NYSE
not_selected
Open SWK chart on TradingViewSupplied coverage reports Q3 net product revenue of $92.1M, patient-form growth, and a planned pivotal study. · The pre-cut series rose to a +6.6875243% change by 18:16:14Z, with price above VWAP and in the upper range. · The sealed 20-session comparison showed underperformance against its healthcare proxy. · Score 5 · $93.76 · +8.47% · 1.87x volume · RSI 58.78 · EMA 91.17 > 91.53 > 96.23 · 52w 76.42% of high · VWAP above · NasdaqGM
not_selected
Open RYTM chart on TradingViewSupplied Q3 coverage reports adjusted EPS of $1.23 versus $1.06 expected, sales of $393.1M versus $381.1M expected, and raised FY2026 guidance. · The pre-cut series reached a +22.665833% change at 18:16:02Z. · Score 5 · $95.35 · +19.34% · 2.00x volume · RSI 80.04 · EMA 83.04 > 80.64 > 79.54 · 52w 99.58% of high · VWAP above · NASDAQ
not_selected
Open LIVN chart on TradingViewSupplied Q3 coverage reports stronger results and a raised FY2026 outlook. · The pre-cut trajectory reached a +15.657896% change at 18:16:44Z. · The supplied case also reports a preliminary DOJ settlement risk. · $87.90 · 1.68x volume · RSI 64.27 · EMA 78.47 > 77.54 > 77.65 · 52w 98.24% of high · VWAP above · NYSE
not_selected
Open XYZ chart on TradingViewSupplied Q2 FY2027 coverage reports revenue growth of 18% to $97.09M, adjusted EPS of $0.64 versus $0.46 expected, service growth, margin expansion, and a raised service outlook. · The pre-cut trajectory reached a +19.068365% change at 18:10:17Z. · Score 3 · $106.10 · +18.53% · 2.02x volume · RSI 76.50 · EMA 90.87 > 88.07 > 88.17 · 52w 97.87% of high · VWAP above · NasdaqGM
not_selected
Open TRNS chart on TradingViewThe supplied Q3 summary reports revenue of $74.1M, up 50.3% year over year, $8.6M free cash flow, and a $20M repurchase authorization. · The same summary reports a $7.6M net loss and an EPS miss. · The pre-cut trajectory reached a +17.004507% change at 18:16:33Z. · Score 5 · $4.97 · +12.05% · 1.30x volume · RSI 67.49 · EMA 4.63 > 4.69 > 4.98 · 52w 76.54% of high · VWAP above · NasdaqCM
not_selected
Open SRTA chart on TradingViewThe sealed narrative record reports that UCB selected Veeva Vault CRM. · Three pre-cut quote observations show the same-session change rising from +1.6490222% to +1.8568006%, with the last observation at 18:16:33Z. · The announcement supplies no contract value, implementation timing, or incremental revenue contribution. · $308.84 · 0.41x volume · RSI 45.51 · EMA 310.13 > 305.59 > 289.86 · 52w 94.53% of high · VWAP above · NYSE
not_selected
Open VEEV chart on TradingViewCompany dossier
History, curiosities & sources

Selected facts and links behind the public profile.
Company description
Flywire is a global payments and software company serving education, healthcare, travel and B2B organizations. It combines a payments platform, a global payment network and industry-specific software embedded in clients’ systems. Its services support complex domestic and cross-border payments, billing, collections, settlement and reconciliation.
History
- Flywire traces its origins to peerTransfer, started in 2009; its investor-relations FAQ lists 2011 as the year Flywire was founded.
- peerTransfer became Flywire in 2015 as the company expanded beyond its original education focus.
- Flywire entered the commercial segment in 2017 and acquired OnPlanU and OnPlan Health in 2018, adding payment and receivables tools for education and healthcare.
- Flywire became publicly traded on Nasdaq on May 26, 2021, under the ticker FLYW.
Curiosities
- Founder Iker Marcaide’s idea followed a difficult international tuition payment that nearly went missing because the banks involved lacked a shared record.
- The Flywire name was chosen to express the company’s focus on high-value payments that cross international borders.
Profile sources
- Investor FAQs
- About Our Global Payments Company
- Payments company Flywire closes $120M, buys Calif. SaaS company
- Flywire Expands Global Payments Platform with the Addition of OnPlanU and OnPlan Health
- Flywire: Simplifying cross-border payments, powering the future of global payments
- peerTransfer rebrands as Flywire