



Panel thesis: FPS remains the provisional Try of the Day after a same-session correction pass.
+6.40% · 1.41x volume · 32.67 > 32.85 > 37.03

Company context
A U.S. manufacturer of customized electrical distribution equipment for data centers, the grid and industrial facilities.
Committee read
This is the committee's read of the evidence, not a probability or score. The confidence allocation is unchanged because the auditor identified a material temporal-labeling issue, not a change in the sealed evidence or comparative selection. Confidence remains conditional on separating the prepared March 31 context snapshot from the September 15 operating-results event, and on treating model outputs as bounded uncertainty with adverse-tail and coverage limitations.
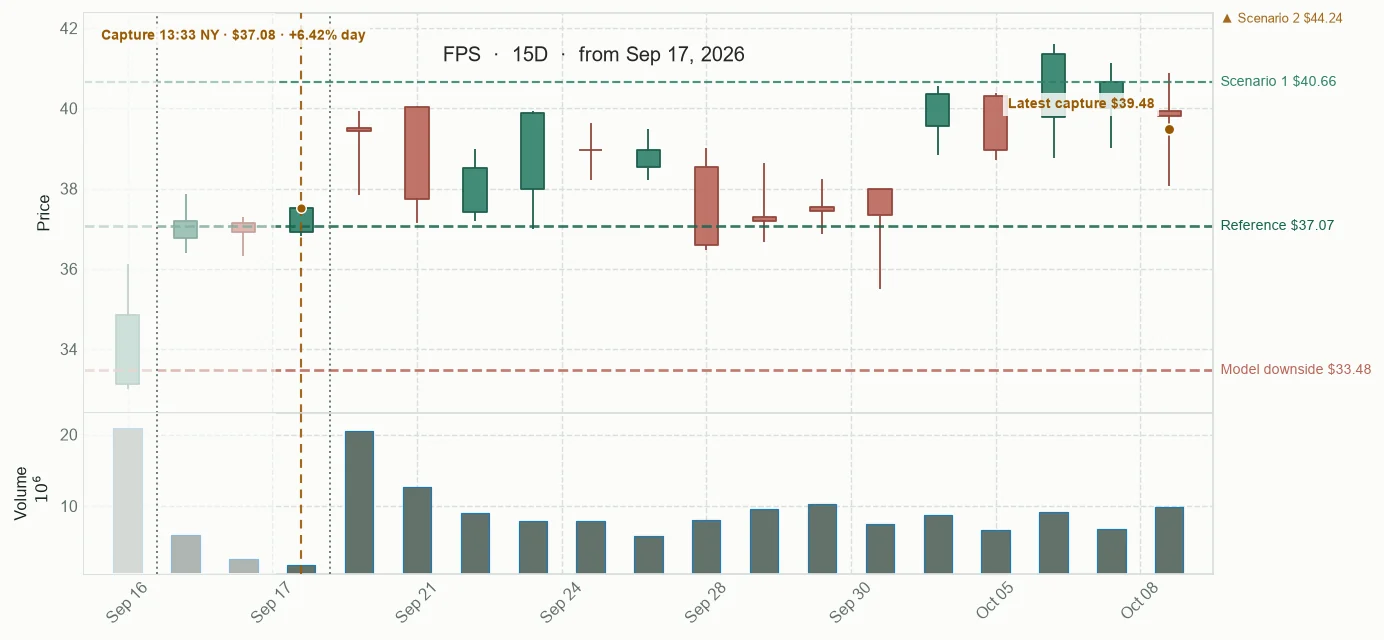
Observed price path
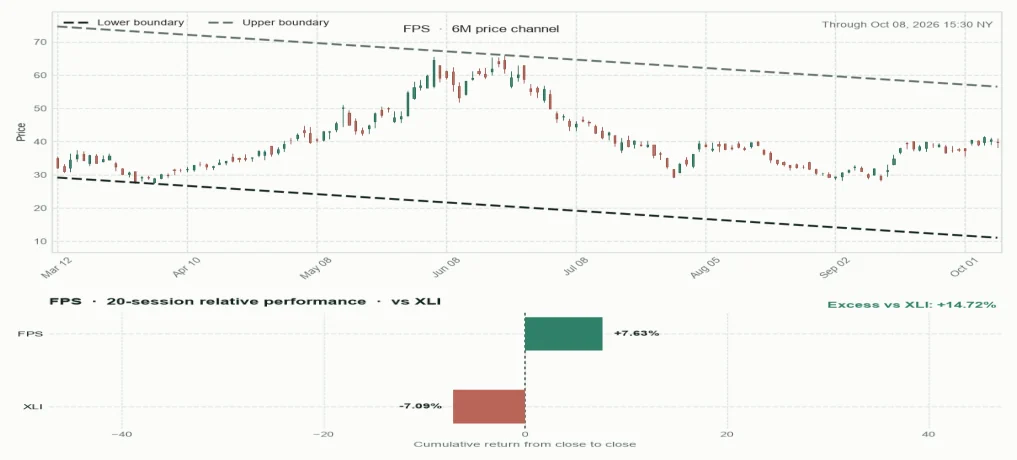
Price channel and relative performance
Forecast fan chart
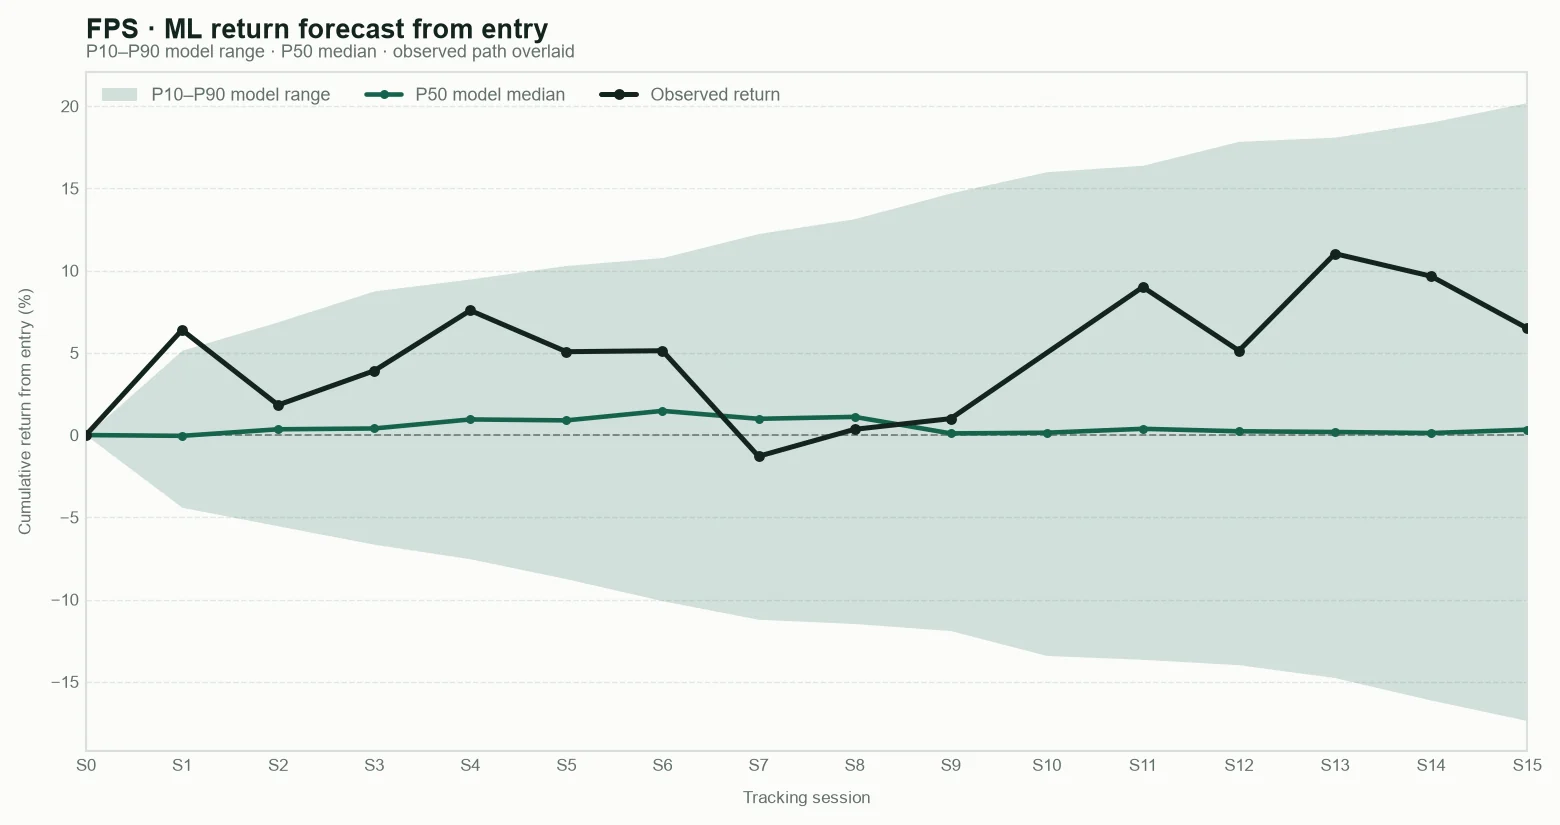
P10 — Cautious outcome: a weak result; most model estimates are above this level.
P50 — Central outcome: the middle estimate; roughly half of the model estimates are above and half below.
P90 — Favourable outcome: a strong result; only the most favourable model estimates are above this level.
These are model reference levels, not guarantees.
Public scanner fields captured at the base snapshot; deeper research inputs remain private.
Snapshot
What was captured at the base
Structure
How price is behaving
Risk and context
What may change the read
Base framework for context and outcome tracking. These are not trading instructions.
Tracking results
Observed daily-bar ranges are retrospective measurements, not targets, stops, or trading instructions.
Tryding Review
Five AI analytical agents reading the same evidence; disagreement stays visible.
“The sealed day is broadly risk-on after the policy shock: the three major benchmarks are higher, volatility is lower, the ten-year yield is lower by 5.50 basis points, the dollar is steady and commodities are mixed. That is a setting, not a candidate.”
That changes the wording, not the case identity. FPS still has a primary-filed operating mechanism, a captured move of 6.42%, and three trajectory points clustered near 6.7%. The selection remains comparative and prospective.
“One boundary before we touch the tickers: a level is not a change. The packet gives levels for indices and commodities and exact changes for selected fields. Fresh aggregate breadth is unavailable because its proxy is stale, so it cannot become either a bullish or bearish vote.”
The public record should therefore say: prepared March 31 context, separate September 15 operating-results event, and no latest-quarter claim. That preserves the evidence hierarchy without discarding the operating mechanism.
Broader Market Context
The day’s sealed context was broadly constructive but uneven: the major U.S. benchmarks rose, volatility declined, Treasury yields eased, the dollar proxy was steady and commodities were mixed. The panel connected that backdrop to FPS only as context. It does not prove execution, replace company-specific evidence or reopen the sealed decision. The Auditor’s temporal correction remains central: the March 31 figures are prepared context-only data, separate from the September 15 operating-results event.
The market snapshot captured at 2026-09-17T17:59:05.156425+00:00 described a supportive session. The S&P 500, Nasdaq 100 and Russell 2000 all recorded positive changes, while the VIX declined. That combination suggests a more receptive risk environment, but it is a description of the market backdrop rather than evidence that every individual stock has a durable catalyst. Kenji clarified that the VIX is an options-implied measure of expected near-term S&P 500 volatility. Its lower reading matters because broad index turbulence was less prominent, but it does not remove single-company execution risk. The 10-year Treasury yield was 4.951%, with a reported change of -5.50 basis points; a basis point is one hundredth of a percentage point. The level and the change are separate facts. The breadth layer was unavailable because the captured intraday proxy was outside its freshness window. That means the panel could not make a validated advancer-versus-decliner statement. Gold and WTI were also mixed, with supplied levels of $4,399.10 and $102.05 respectively. Those are levels, not changes, so they should not be narrated as gains or losses without an exact delta. Against that wider setting, Forgent’s business sits in an infrastructure-sensitive part of the economy: electrical distribution equipment for data centers, the grid and industrial facilities. Its official materials describe a recent parent company built from older operating businesses, which explains why a company incorporated in 2025 can describe more than a century of combined manufacturing experience. The public explanation should still preserve the two evidence clocks identified by the Auditor: prepared context for the quarter ended March 31 and the separate September 15 operating-results event. The useful conclusion is restrained. Broad risk appetite may make the environment more forgiving, but it cannot confirm backlog conversion, delivery timing or cash-flow durability. Those remain issuer-level questions for the published thesis. The Coffee therefore closes with the wider market as a lens, not as a selection formula or a prediction engine.
Sources consulted: Reuters · Insider Monkey · Oilprice.com · Proactive · Barrons.com · Investor's Business Daily
Coffee conversation
“The day opened with a supportive broad-market tone: the S&P 500, Nasdaq 100 and Russell 2000 all had positive changes. That matters as background, but a green index is not proof that a single-company thesis will persist.”
“The VIX also moved lower. It is an options-implied gauge of expected near-term S&P 500 volatility, so the practical meaning is calmer index pricing, not the disappearance of company-specific risk. The 10-year yield stood at 4.951%, with a reported change of -5.50 basis points; that level and change must remain distinct.”
“There was no fresh validated breadth layer. In plain terms, we could not reliably say how many individual stocks were advancing or declining. That is a coverage boundary, not evidence that participation was weak.”
“The cross-asset picture was mixed rather than uniformly risk-on. Gold and WTI were supplied at levels of $4,399.10 and $102.05, while separate reporting discussed gasoline and diesel pressure. Those prices are levels; without an exact delta, they are not gains or losses.”
“That distinction keeps the day readable. The backdrop can explain why investors were willing to absorb risk, but it cannot tell us whether a company-specific operating mechanism will convert into delivery, revenue or cash flow.”
“Forgent sits directly in that infrastructure question. Its official profile describes engineered-to-order electrical distribution equipment for data centers, the power grid and energy-intensive industrial facilities. Engineered-to-order means the products are configured for demanding projects rather than sold only as standardized catalog items.”
“Its history also needs careful wording. The parent company was incorporated in 2025, while its operating platform was assembled from businesses including MGM, PwrQ, States and VanTran. That is why the company can be young as a legal issuer while describing more than 100 years of combined manufacturing experience.”
“The Auditor’s correction belongs in the public explanation too. The prepared figures for the quarter ended March 31 are historical context from a September 1 snapshot. They are not the September 15 operating-results event, so readers should not be given one blended timeline.”
“That separation also prevents the model from becoming a shortcut. A contextual probability or dispersion range can describe uncertainty, but it cannot establish that the operating mechanism is working. The public test remains observable company evidence over time.”
“So the wider day gives the publication a setting, not an answer. Risk appetite was constructive, volatility was contained and cross-asset signals were mixed. The remaining analytical question is whether the company-specific evidence can carry the thesis beyond the announcement window.”
Timeline
FPS closes its 15-session track at +7.36% from the $37.07 entry. The canonical checkpoints were +6.39% at S1, +5.07% at S5 and +0.70% at S10; the final best favorable excursion was +12.25% and the worst adverse excursion was -4.21%. The final provider price capture was $39.80 with volume at 1.17 times average. A separate after-hours quote was $39.60 (-0.5%, timestamped 23:11 Canary). The September 15 filing and later FY27 outlook supported the original mechanism, but this dossier shows no new orders or cash flow confirming conversion; the June 30 backlog predates the event. Final session-average price, RSI, EMA trend and 52-week position were unavailable. Tracking is closed.
FPS's tracked gain fell 4.10 points to +6.93% as the $39.45 capture stood 1.96% below VWAP near the bottom of the observed range, despite time-adjusted volume close to normal in this early sample. The stock still leads Industrials by 29.41 points over 20 sessions, but the reversal weakens near-term follow-through. The September filing is verified; the separate March snapshot does not show that the event has produced new orders or cash flow.
FPS's tracked gain rose 3.11 points to 8.24% from the prior public update, and the $40.58 capture stood 1.45% above VWAP near the session high. Its 26.55-point 20-session lead over Industrials remains large but narrowed; the move came on below-normal participation and still does not connect the September filing to new orders or cash flow.
FPS tracked return fell 1.30 points to 5.04% as the latest $39.09 capture dropped 3.14%, sat 0.97% below the volume-weighted session average and near the daily low on 0.52 times usual volume. That weakens the price case behind the earlier +9.00% update, though FPS still leads Industrials by 27.38 points over 20 sessions. The September filing remains confirmed, but no new orders or cash-flow evidence ties it to operating conversion; the near-even model range neither backs the rebound nor explains the current drop.
FPS's tracked gain climbed 8 points to +9%, and shares rose 8.18% above VWAP; its 34.51-point lead over Industrials and positive accumulation strengthen the market response. Volume was 0.69 times average and the model remained near even, so the price case has improved without showing that the September filing has turned into new orders or cash flow.
FPS's tracked return improved 3.96 points to +2.67% as shares rose 2.92% to $37.66, though they remained 0.84% below the $37.98 session VWAP on only 0.17 times average volume. Its 20-session lead over Industrials widened to 26.88 points, repairing part of the recent break without confirming follow-through. The near-even model and missing order or cash-flow conversion evidence leave the September operating thesis unresolved.
FPS's tracked return fell 4.95 percentage points to -0.62%, while the stock dropped 5.41% and finished 1.59% below its volume-weighted average price on below-average volume. That reverses yesterday's price support; a 25.97-point 20-session lead over Industrials remains, but neither the gap nor the September filing shows that the operating case has produced orders or cash flow.
FPS's tracked gain fell 4.10 points to 3.48%; at the 10:06 a.m. ET snapshot, shares were down 3.08%, just below the session's volume-weighted price, with trading pace at about 36% of usual for that time. Its 20-session lead over Industrials remains 24.75 points, and the filed outlook and June-dated backlog still support the operating case without proving orders or cash flow; today's retreat weakens market confirmation, while the model's near-flat, roughly -2.8% to +2.8% next-session range leaves follow-through unresolved.
FPS's tracked gain rose 0.83 points to 7.58% as shares gained 3.53% and closed 1.84% above VWAP near the top of the range, with dollar volume near its twenty-day average. The issuer's new FY27 outlook and June 30 backlog add operating support to the September event, but a near-even model with a wide range leaves durability unproven.
FPS's tracked gain rose 0.49 points to 4.40% after a 2.31% advance that held 2.71% above VWAP in the upper range. The filed operating event and 20-session Industrials lead support the case, but volume was only 0.18x average with decelerating participation; the near-even model distribution reinforces that this is a constructive hold, not proof that the operating mechanism has converted into durable follow-through.
FPS's tracked gain narrowed 5.34 points to 1.05% as the latest capture fell 5.25% to 37.37, sitting 2.17% below VWAP near the bottom of its range on only 0.25 times average volume. The filed operating event and 19.09-point Industrials-relative lead remain supportive facts, but the model's roughly 48%-50% same-direction read and wide remaining range reinforce the adverse tape: the thesis now needs repair before follow-through.
FPS's tracked result rose 3.87 points on the first follow-up session, but the latest capture added only 1.16% to $38.50, sat 0.77% below VWAP and showed decelerating volume at 0.34x average. The primary-filed operating event and 20-session outperformance versus Industrials remain supportive, yet the response is not a clean hold; confirmation still requires the price to retain the event response without a fresh loss of relative strength.
Panel thesis: From S0 through S15, FPS offers the most defensible prospective path because a primary-filed operating event is supported by documented operating evidence from a prepared, context-only snapshot, while the market response remains constructive without the most severe event-day extension. The March 31 figures are not presented as the September 15 operating-results event. The thesis depends on continued relative strength and confirmation that the operating mechanism persists. Invalidation boundary: A next-session loss of the event response and VWAP with deteriorating relative strength, or issuer evidence that the September 15 operating-results event, backlog and guidance do not support orders and cash flow, falsifies the selected thesis.
Panel comparison
Selected candidate versus the alternatives retained from the panel comparison.
Latest display-only snapshot · Oct 8, 2026 · 18:24 NYSE
Since base +2.81% · Today +0.13% · Since prior -6.62% · Vs S&P 500 +0.60% · Vs Nasdaq 100 +1.53% · Vs Russell 2000 +0.10% · Relative volume 1.41 · RSI 61.85 · EMA 32.67 > 32.85 > 37.03 · VWAP below · 52-week high 56.17% · As of Sep 17, 2026 · 17:10 NYSE
Since base +0.55% · Today -0.10% · Since prior 0.00% · Vs S&P 500 +0.37% · Vs Nasdaq 100 +1.29% · Vs Russell 2000 -0.13% · Relative volume 2.55 · RSI 63.62 · EMA 38.04 > 37.95 > 37.96 · VWAP above · 52-week high 82.88% · As of Sep 17, 2026 · 16:44 NYSE
Since base +3.10% · Today +1.63% · Since prior 0.00% · Vs S&P 500 +2.10% · Vs Nasdaq 100 +3.02% · Vs Russell 2000 +1.60% · Relative volume 2.32 · RSI 61.76 · EMA 7.64 > 7.01 > 6.78 · VWAP above · 52-week high 97.63% · As of Sep 17, 2026 · 17:19 NYSE
Since base +0.15% · Today +0.25% · Since prior 0.00% · Vs S&P 500 +0.72% · Vs Nasdaq 100 +1.65% · Vs Russell 2000 +0.22% · Relative volume 5.92 · RSI 55.85 · EMA 186.84 > 191.64 > 208.34 · VWAP below · 52-week high 70.00% · As of Sep 17, 2026 · 17:12 NYSE
Since base -0.73% · Today -0.70% · Since prior 0.00% · Vs S&P 500 -0.23% · Vs Nasdaq 100 +0.70% · Vs Russell 2000 -0.73% · Relative volume 1.95 · RSI 61.55 · EMA 67.6 > 64.04 > 59.51 · VWAP above · 52-week high 76.18% · As of Sep 17, 2026 · 17:22 NYSE
Since base -1.37% · Today +0.83% · Since prior 0.00% · Vs S&P 500 +1.29% · Vs Nasdaq 100 +2.22% · Vs Russell 2000 +0.80% · Relative volume 4.04 · RSI 78.9 · EMA 6.39 > 6.23 > 6.38 · VWAP above · 52-week high 82.96% · As of Sep 17, 2026 · 17:03 NYSE
Since base -0.12% · Today -0.63% · Since prior 0.00% · Vs S&P 500 -0.17% · Vs Nasdaq 100 +0.76% · Vs Russell 2000 -0.67% · Relative volume 1.31 · RSI 62.85 · EMA 7.12 > 7.16 > 7.68 · VWAP above · 52-week high 44.25% · As of Sep 17, 2026 · 17:04 NYSE
Since base +1.91% · Today +1.05% · Since prior 0.00% · Vs S&P 500 +1.52% · Vs Nasdaq 100 +2.45% · Vs Russell 2000 +1.02% · Relative volume 1.47 · RSI 65.34 · EMA 24.1 > 23.72 > 22.54 · VWAP below · 52-week high 94.53% · As of Sep 17, 2026 · 17:09 NYSE
Since base -0.28% · Today +6.00% · Since prior 0.00% · Vs S&P 500 +6.47% · Vs Nasdaq 100 +7.39% · Vs Russell 2000 +5.97% · Relative volume 1.42 · RSI 59.35 · EMA 12.04 > 11.79 > 11.47 · VWAP below · 52-week high 95.80% · As of Sep 17, 2026 · 16:15 NYSE
Since base -3.48% · Today +1.00% · Since prior 0.00% · Vs S&P 500 +1.47% · Vs Nasdaq 100 +2.40% · Vs Russell 2000 +0.97% · Relative volume 1.29 · RSI 65.66 · EMA 19.2 > 18.04 > 17.34 · VWAP above · 52-week high 91.33% · As of Sep 17, 2026 · 17:16 NYSE
Benchmarks
Today -0.47% · previous regular close · As of Oct 8, 2026 · 18:24 NYSE
Today -1.39% · previous regular close · As of Oct 8, 2026 · 18:24 NYSE
Today +0.03% · previous regular close · As of Oct 8, 2026 · 18:24 NYSE
Company dossier
History, curiosities & sources

Selected facts and links behind the public profile.
Company description
Forgent Power Solutions designs and manufactures engineered-to-order electrical distribution equipment for data centers, the power grid and energy-intensive industrial facilities. Its products include transformers, switchgear, transfer switches, power distribution units, panelboards and related services.
History
- Forgent Power Solutions, Inc. was incorporated in Delaware on July 21, 2025 and became a public company on February 5, 2026.
- The operating platform was assembled through acquisitions including MGM on October 31, 2023, PwrQ on March 13, 2024, States on May 31, 2024 and VanTran on June 14, 2024.
- On May 8, 2025, the businesses were combined under the Forgent operating structure; the Forgent parent brand was subsequently introduced for MGM Transformers, PwrQ, States Manufacturing and VanTran.
- The company’s fiscal year ends on June 30.
Curiosities
- The legal parent is recent, while Forgent describes the combined operating businesses as bringing more than 100 years of electrical-distribution manufacturing experience.
- Forgent says it operates 10 manufacturing campuses across five geographic locations, with more than 2 million square feet of manufacturing space and more than 1,800 employees.
- Its engineered-to-order model means equipment is configured for demanding customer projects rather than supplied only as standardized catalog products.
- The company states that it manufactures every major category of electrical distribution equipment in-house.