



Panel thesis: RRC's all-stock agreement with EQT is a concrete event to investigate. The decision remains Raw because the full 15-session path is not yet defensible from the sealed evidence. RRC's setup is unusually unlike the model's comparison cases, so its model estimates warrant added caution.
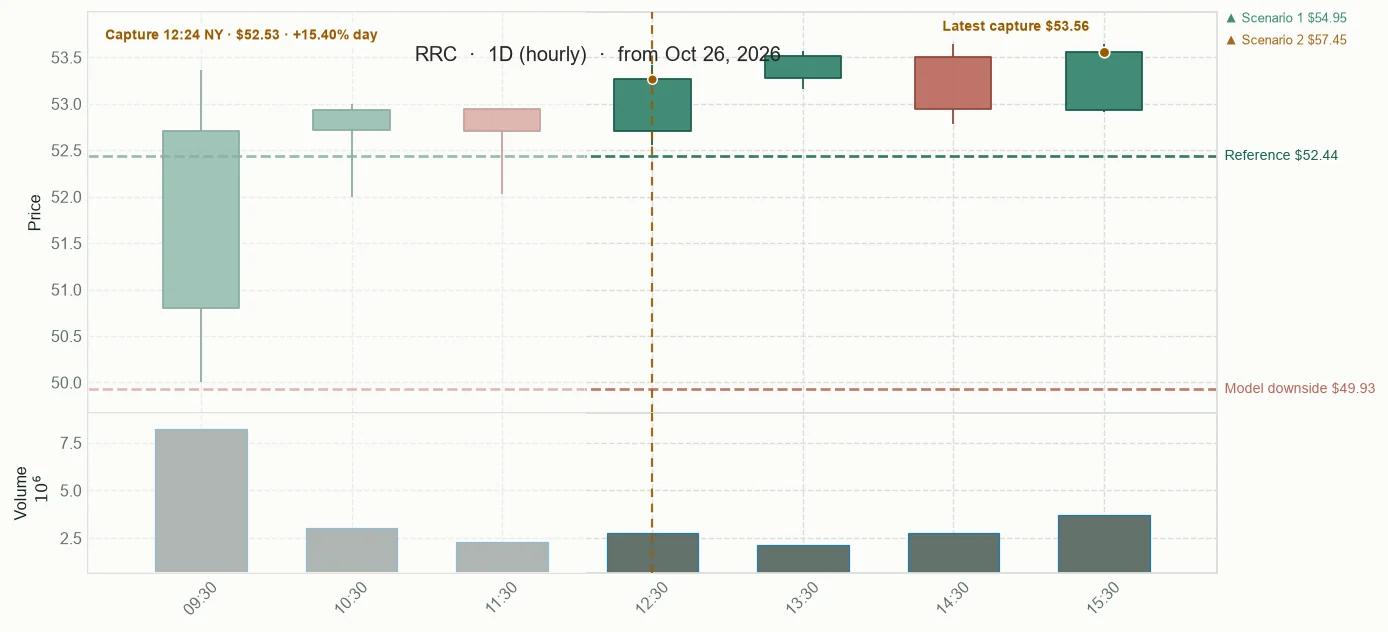
+15.20% · 5.13x volume · 45.04 > 42.75 > 41.33

Company context
An independent U.S. natural-gas and NGL producer focused on the Appalachian Basin.
Committee read
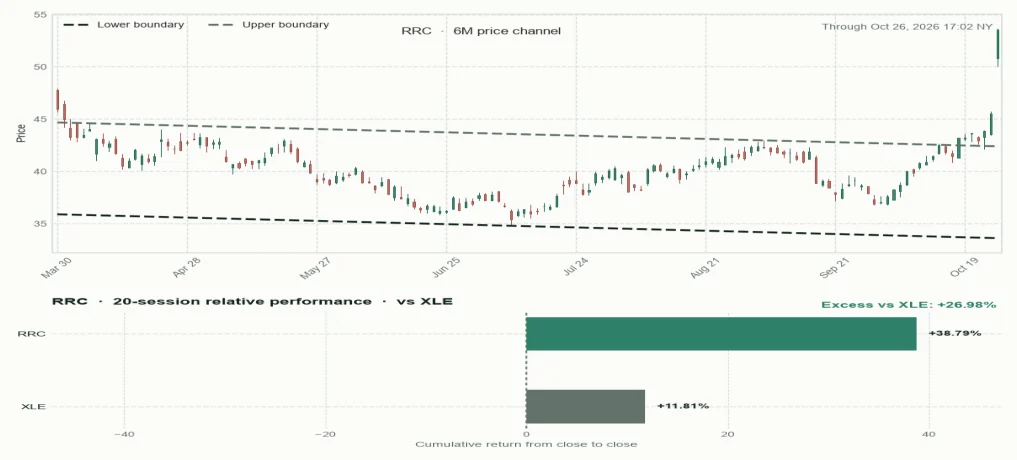
This is the committee's read of the evidence, not a probability or score. RRC's documented agreement and pre-cut relative behavior support a useful investigation, while the extended price, next-session earnings and unresolved all-stock value path keep the 15-session continuation unproven. RRC's unusually low model typicality means its model estimates receive added caution; the Raw decision rests on the sourced event and observable checks.
Observed price path
Price channel and relative performance
Forecast fan chart
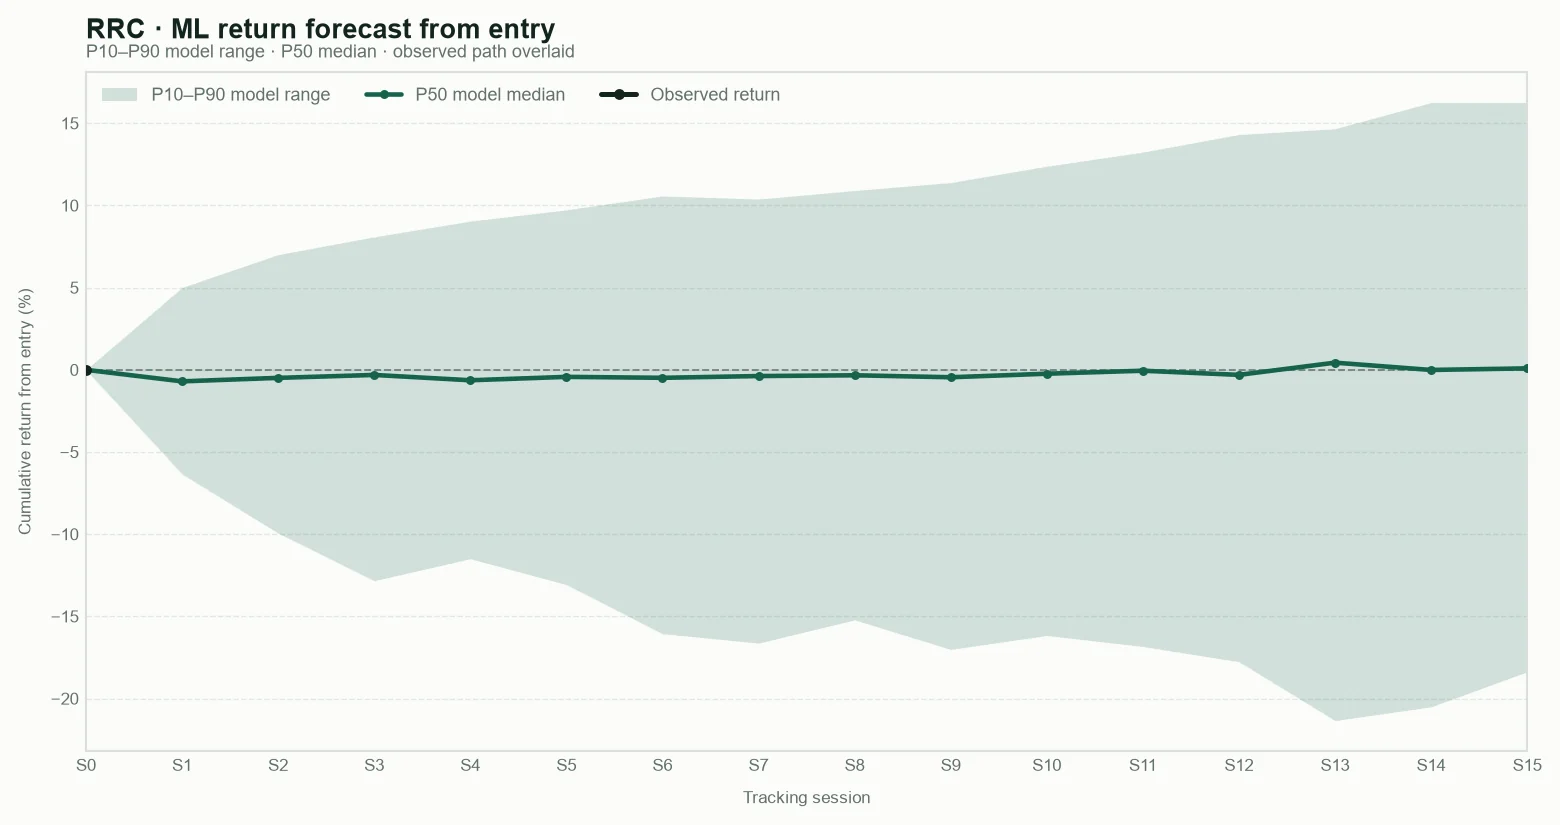
P10 — Cautious outcome: a weak result; most model estimates are above this level.
P50 — Central outcome: the middle estimate; roughly half of the model estimates are above and half below.
P90 — Favourable outcome: a strong result; only the most favourable model estimates are above this level.
These are model reference levels, not guarantees.
Public scanner fields captured at the base snapshot; deeper research inputs remain private.
Snapshot
What was captured at the base
Structure
How price is behaving
Risk and context
What may change the read
Base framework for context and outcome tracking. These are not trading instructions.
Tracking results
Observed daily-bar ranges are retrospective measurements, not targets, stops, or trading instructions.
Tryding Review
Five AI analytical agents reading the same evidence; disagreement stays visible.
“The 18:00 snapshot shows the three broad benchmarks higher and volatility lower. The separate breadth read is only partial, so I would call the backdrop firm, not uniformly broad.”
No. It is a similarity percentile, not return odds: higher values mean a setup looks more typical of the model's comparison cases. RRC's 7.3rd percentile is unusually low, so its session-15 probability and downside estimates fit this case less well than the 19-of-23 feature coverage alone suggests. The adverse-tail estimate remains material, and the Raw Try rests on the documented agreement and observable checks, not the model.
“The day's public news is cross-current: France's 10-year yield crossed 5%, Hormuz flow estimates topped 14.5 million barrels a day but exclude bypass pipelines, and the IEA reported sharp gains in strategic minor metals. None gives us a verified link to this candidate set.”
TTMI deserves credit for holding above VWAP, but its 20-session return lagged XLK by 25.78 points and the Q3-results summary is secondary. SAIQ's letter of intent is not recognized revenue; FRMM's reported GPU amount does not establish utilization or financing. LU remains below VWAP with much weaker relative performance.
Broader Market Context
U.S. index conditions were firm, while rates, energy supply, critical-material demand and financing news pointed to different pressures, with important claims still bounded or conflicting.
The supplied 18:00 UTC snapshot described a firm U.S. session, but the wider day had no single market story. France's ten-year sovereign yield crossed 5%, its highest level since 2002, while the U.S. ten-year yield was 4.982%. An estimate of recent oil flows through the Strait of Hormuz exceeded 14.5 million barrels per day but excluded UAE and Saudi bypass pipelines, so it was not a complete regional flow measure. The International Energy Agency reported that strategic minor-metal prices more than doubled amid export controls and demand. Brazil's runoff produced a narrow result. Reports on SpaceX's AI-chip debt also conflicted: CNBC reported that the deal had closed, while Bloomberg said pricing discussions continued Sunday. These developments frame the day's policy, supply-security and financing questions without establishing a causal link between them. The RRC/EQT natural-gas transaction sits near the wider energy-demand discussion, but that backdrop does not establish its terms or economics.
Sources consulted: Charlie Bilello · Javier Blas · Javier Blas · International Energy Agency · Reuters · CNBC · Bloomberg
Coffee conversation
“At the 18:00 UTC snapshot, the S&P 500 was up 0.78%, the Nasdaq 100 1.34% and the Russell 2000 0.51%. The VIX stood at 18.57, down 4.52%. It is a gauge of expected near-term market volatility, so that points to calmer pricing, not an absence of risk.”
“The separate breadth read—how many sampled stocks rose versus fell—leans positive, but it was an intraday proxy with partial coverage and no end-of-day layer. It can suggest participation; it cannot settle how widely the move was shared.”
“France's ten-year government borrowing yield crossed 5%, its highest since 2002, and its premium over Germany neared levels last seen during the euro-debt crisis. The U.S. ten-year yield in the snapshot was 4.982%. That is not one clean global rates story.”
“By premium, you mean France pays more to borrow than Germany?”
“Exactly—the spread is the difference between their yields. It was near an older crisis-era range; that signals relative pressure, not that the same crisis has returned.”
“The Hormuz estimate is above 14.5 million barrels per day, but it excludes UAE and Saudi bypass pipelines. That makes it a chokepoint flow estimate, not a total-supply tally.”
“The International Energy Agency says strategic minor-metal prices more than doubled amid export controls and demand, after critical-mineral prices rebounded in 2025 and early 2026. That is a supply-security signal; it does not mean every mineral market moved together.”
“Brazil's runoff ended narrowly: Lula received 51.8% and Flávio Bolsonaro 48.2%. That is a consequential policy backdrop, but this brief does not connect the result to U.S. equity direction.”
“The SpaceX AI-chip debt reports do not line up: CNBC said the deal closed, while Bloomberg said pricing discussions continued Sunday. Those are different statuses, so the financing claim needs to stay qualified.”
“That puts energy demand and AI infrastructure in the same conversation, but they are separate mechanisms. The SpaceX financing reports do not establish the economics of the RRC/EQT gas transaction.”
Timeline
Panel thesis: RRC's documented all-stock agreement with EQT creates a specific repricing event to investigate. The 15-session question is whether the reported exchange terms, transaction conditions and next-session earnings support continued relative behavior; this Raw Try does not claim RRC has the best prospective path. Invalidation boundary: A primary filing that materially revises the reported exchange ratio or transaction conditions, or a post-earnings full-session close below $52.41 VWAP with deteriorating relative performance, would falsify the research thesis.
Panel comparison
Selected candidate versus the alternatives retained from the panel comparison.
Latest display-only snapshot · Oct 26, 2026 · 19:42 NYSE
Since base +1.83% · Today +17.66% · Since prior -0.19% · Vs S&P 500 +16.96% · Vs Nasdaq 100 +16.57% · Vs Russell 2000 +17.28% · Relative volume 10.23 · RSI 88.86 · EMA 45.25 > 42.84 > 41.22 · VWAP above · 52-week high 99.80% · As of Oct 26, 2026 · 18:25 NYSE
Since base -1.28% · Today +0.12% · Since prior 0.00% · Vs S&P 500 -0.58% · Vs Nasdaq 100 -0.97% · Vs Russell 2000 -0.26% · Relative volume 1.8 · RSI 29.84 · EMA 8.66 > 9.54 > 11.12 · VWAP below -2.30% · 52-week high 24.88% · As of Oct 26, 2026 · 16:05 NYSE
Since base -4.46% · Today +1.93% · Since prior -0.15% · Vs S&P 500 +1.24% · Vs Nasdaq 100 +0.84% · Vs Russell 2000 +1.55% · Relative volume 2.25 · RSI 58.12 · EMA 5.6 > 5.95 > 7.55 · VWAP above -2.14% · 52-week high 56.76% · As of Oct 26, 2026 · 18:23 NYSE
Since base +0.58% · Today +3.02% · Since prior +0.71% · Vs S&P 500 +2.32% · Vs Nasdaq 100 +1.93% · Vs Russell 2000 +2.64% · Relative volume 1.26 · RSI 30.63 · EMA 93.54 > 104.59 > 113.56 · VWAP above +3.56% · 52-week high 39.34% · As of Oct 26, 2026 · 18:04 NYSE
Since base -10.48% · Today -5.98% · Since prior +0.25% · Vs S&P 500 -6.68% · Vs Nasdaq 100 -7.07% · Vs Russell 2000 -6.36% · Relative volume 2.13 · RSI 23.21 · EMA 3.62 > 4.02 > 4.55 · VWAP above -9.20% · 52-week high 14.65% · As of Oct 26, 2026 · 18:17 NYSE
Since base -2.68% · Today +0.72% · Since prior 0.00% · Vs S&P 500 +0.02% · Vs Nasdaq 100 -0.37% · Vs Russell 2000 +0.34% · Relative volume 4.5 · RSI 72.56 · EMA 25.8 > 25.09 > 24.45 · VWAP below -4.14% · 52-week high 89.98% · As of Oct 26, 2026 · 17:09 NYSE
Since base +6.69% · Today +2.30% · Since prior +0.46% · Vs S&P 500 +1.60% · Vs Nasdaq 100 +1.21% · Vs Russell 2000 +1.92% · Relative volume 28.5 · RSI 30.34 · EMA 2.05 > 2.59 > N/A · VWAP below -7.46% · 52-week high 28.97% · As of Oct 26, 2026 · 18:23 NYSE
Benchmarks
Today +0.70% · previous regular close · As of Oct 26, 2026 · 19:41 NYSE
Today +1.09% · previous regular close · As of Oct 26, 2026 · 19:41 NYSE
Today +0.38% · previous regular close · As of Oct 26, 2026 · 19:41 NYSE
Company dossier
History, curiosities & sources

Selected facts and links behind the public profile.
Company description
Range Resources Corporation is an independent U.S. producer of natural gas and natural gas liquids focused on the Appalachian Basin. Its Pennsylvania acreage spans the Marcellus, Utica and Upper Devonian formations.
History
- The business traces its Appalachian oil-and-gas activity to 1976; the company was incorporated as Lomak Petroleum, Inc. in 1980.
- Lomak completed an initial public offering after incorporation and listed its common stock on the New York Stock Exchange in 1996.
- Lomak became Range Resources Corporation following the Domain Energy transaction, effective August 25, 1998.
- Range reports that its Renz #1 was the first viable Marcellus exploratory well, completed in Washington County, Pennsylvania, in 2004.
- Range drilled a successful horizontal Marcellus well, Gulla 9H, in 2007.
Curiosities
- The Renz #1 had an initial rate of about 300 thousand cubic feet of gas per day, enough to continue Marcellus exploration.
- A three-point correlation from the first three horizontal wells led Range to move its landing zone higher within the Marcellus.
- Range says it became the first North American company to export ethane to Europe in 2016.
- In 2013, Range reported that corporate net production first exceeded one billion cubic feet equivalent per day, while Marcellus gross production also reached that level.