



+18.47% · 1.81x volume · 126.82 > 123.27 > 118.01
Panel thesis: SHOP wins the comparative daily review on issuer relevance, relative strength, participation and current structure. The label remains conditional on holding above VWAP with sustained participation because the move is already 2.81 ATR extended.

Company context
Shopify Inc., a commerce technology company, provides tools to start, scale, market, and run a business of various sizes in Canada, the United States, Europe, the Middle East, Africa, the Asia Pacific, and Latin America. The Company offers Shopify platform that enables…
Committee read
This is the committee's read of the evidence, not a probability or score. SHOP leads the verified comparison and has constructive current tape structure, but the large extension and single-session evidence keep conviction conditional.
Observed price path
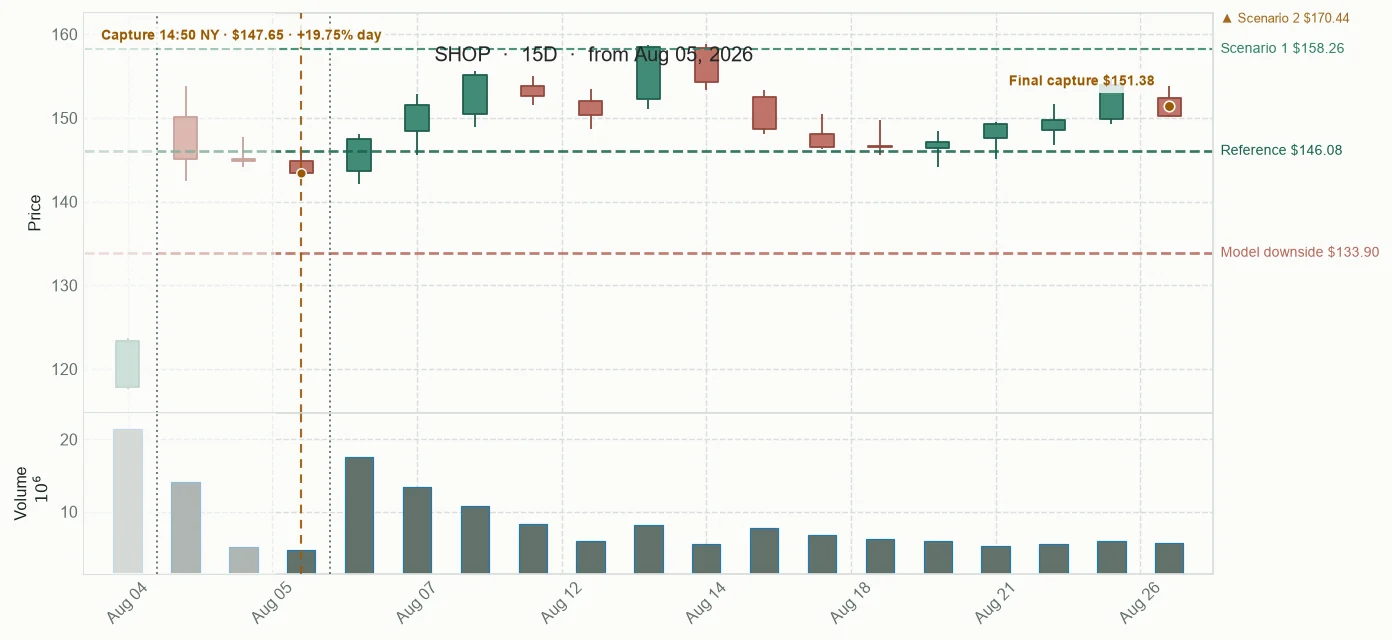
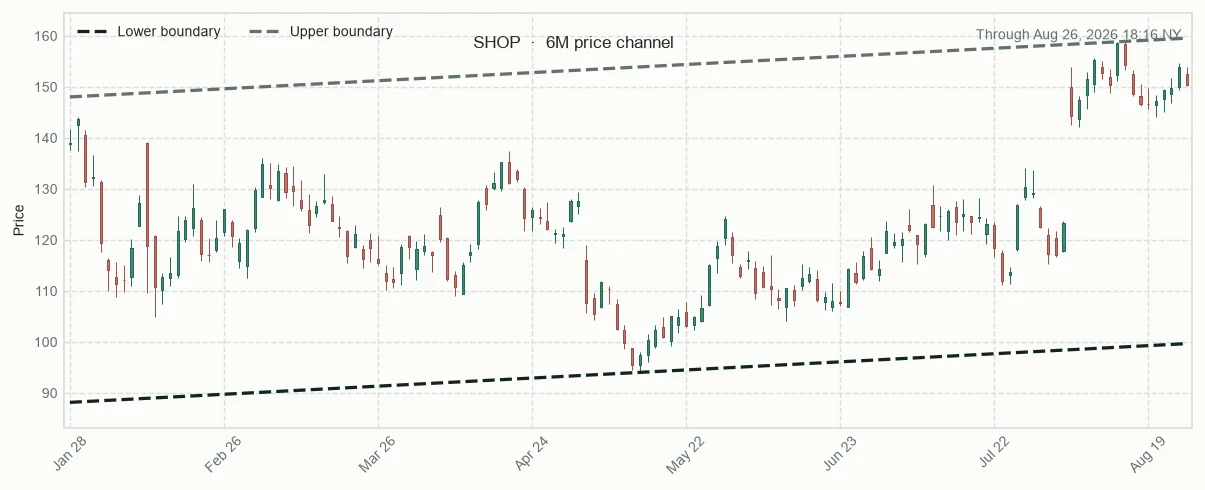
Price channel and relative performance
Public scanner fields captured at the base snapshot; deeper research inputs remain private.
Snapshot
What was captured at the base
Structure
How price is behaving
Risk and context
What may change the read
Base framework for context and outcome tracking. These are not trading instructions.
Tracking results
Observed daily-bar ranges are retrospective measurements, not targets, stops, or trading instructions.
Tryding Review
Five AI analytical agents reading the same evidence; disagreement stays visible.
“SHOP has the strongest comparative profile, but the one-session observation cannot establish a calibrated continuation probability.”
Keep the label falsifiable and do not turn a large move into certainty.
“SHOP has the clearest issuer-linked information and relative strength in the sealed case.”
A credible catalyst still needs tape confirmation after the initial repricing.
Broader Market Context
Record highs and Middle East relief supported the Dow and S&P, while the Nasdaq absorbed pressure from SpaceX and AMD and investors rotated across sectors. The market was broadening, but technology was no longer carrying every argument.
Oil and Treasury reports improved on hopes around the Hormuz route while the Dow and S&P extended their records. The Nasdaq was less comfortable as technology absorbed pressure even while broader sector-rotation coverage argued for a healthier distribution of leadership. The dollar stayed steady and the Middle East remained an active risk rather than a closed chapter. The desk saw a market trying to broaden without fully releasing its dependence on a few technology narratives. That can be constructive if the rotation reflects real demand; it can also be a sign that investors are trimming crowded winners while the index remains supported. The distinction mattered more than the record headline.
Sources consulted: Reuters · Barrons.com · Motley Fool · The Wall Street Journal
Coffee conversation
“The Dow and S&P were making records while the Nasdaq was being reminded that an index can rise without every technology story being forgiven. That earns attention, not a settled regime.”
“Sector rotation was the day's constructive idea, but it had to prove it was demand rather than profit-taking in disguise. There is an operating story here, and waving it away would be lazy.”
“Oil relief and steady Treasuries helped the tape, while a steady dollar and firm gold kept the geopolitical hedge visible. The source supports the event; it does not automatically support the interpretation.”
“The risk was confusing a better-distributed index with a fully repaired technology market before the next earnings and employment data. A good headline does not make the risk disappear; it moves the risk.”
“Record highs and Middle East relief supported the Dow and S&P, while the Nasdaq absorbed pressure from SpaceX and AMD and investors rotated across sectors. The move has energy, but the follow-through is where the argument gets tested.”
“The tape still has to do the unglamorous part.”
Timeline
SHOP's fifteen-session tracking closes at a canonical +1.88% from the $146.08 reference. The fresh final regular capture was $150.29, or +2.88% versus that reference, after a -2.33% session and -2.46% versus the prior regular close; the extended quote was $150.33 (+0.03%). Participation was 0.61x, RSI 65.80 and the EMA structure was 130.38 > 125.17 > 118.78. The original Try of the Day had an issuer-linked information event, strong relative performance and an above-average-price structure, but the path did not make continuation durable; maximum favorable excursion was +7.70% and maximum adverse excursion was -3.67%. Current 52-week position and episode-specific X evidence are unavailable. Tracking ends.
SHOP added 0.32 percentage points to its tracked result as the current capture rose 2.72% and moved back 0.34% above VWAP. Technology still gives it a strong longer-term edge, but participation is only 0.61 times average and the 1.96-ATR extension keep the issuer-linked recovery conditional on durable demand.
SHOP tracked return has fallen 0.63 points since the prior public update as the latest capture dropped 3.22% on 0.55x relative volume and sits 0.31% below VWAP. The issuer-linked case retains an 11.54-point sector edge, but weak demand after a 2.81-ATR extension keeps the read in repair rather than fresh confirmation.
SHOP's published return fell 3.24 points to +4.23% as the latest capture dropped 2.51% on 0.14x relative volume and moved 1.08% below the session's average traded price. The issuer-linked repricing still has a strong performance edge and rising EMAs, but the loss of that intraday reference with weak demand shifts the follow-up toward repair rather than clean continuation.
SHOP's tracked return added 2.57 points from +4.23% as the latest capture rose 4.91% on 0.54x relative volume, with price 2.25% above the session's average traded price and an 18.57-point Technology advantage. That keeps the issuer-linked repricing structurally strong, but RSI 77.49, neutral money flow and a 95.8% range position make clean continuation dependent on renewed demand.
SHOP added 3.31 percentage points to tracked return, reaching +3.26% as the latest capture rose 2.91% on 0.33x participation. Rising EMAs, a 23.42-point sector advantage and price 1.25% above VWAP materially repair the event thesis, but the high range position and neutral flow keep the clean-hold condition conditional after the sharp rebound.
Panel thesis: SHOP is the Try of the Day while it holds above VWAP, preserves participation and converts the initial repricing into continuation; a loss of that structure or fading participation invalidates the thesis. Invalidation boundary: Loss of VWAP with weakening participation or failure to convert the initial move into continuation.
Other candidates
Alternatives retained from the source publication.
Latest display-only snapshot · Aug 26, 2026 · 18:16 NASDAQGS
Since base -2.10% · Today +0.12% · Since prior -6.15% · Relative volume 1.81 · RSI 64.65 · EMA 126.82 > 123.27 > 118.01 · 52-week high 80.57% · As of Aug 5, 2026 · 17:21 NASDAQGS
No fresh comparison data · As of Aug 26, 2026 · 18:16 NASDAQGS
No fresh comparison data · As of Aug 26, 2026 · 18:16 NASDAQGS
No fresh comparison data · As of Aug 26, 2026 · 18:16 NASDAQGS
Company dossier
History, curiosities & sources

Selected facts and links behind the public profile.
Company description
Shopify Inc., a commerce technology company, provides tools to start, scale, market, and run a business of various sizes in Canada, the United States, Europe, the Middle East, Africa, the Asia Pacific, and Latin America. The Company offers Shopify platform that enables merchants to manage products and inventory, process orders and payments, fulfill and ship orders, build customer relationships, source products, leverage analytics, and reporting and access financing for running their business across all of their sales channels, including web and mobile storefronts, physical retail locations, social media storefronts, and marketplaces. It also provides Shopify Payments, a fully integrated payment processing service that allows merchants to accept and process payment cards online and offline. In addition, the company engages in the sale of themes and apps; shipping labels through Shopify Shipping; point-of-sale hardware; advertising on the Shopify App Store; and Shop Campaigns for buyer acquisitions, as well as registration of domain names. The company was formerly known as Jaded Pixel Technologies Inc. and changed its name to Shopify Inc. in November 2011. Shopify Inc. was incorporated in 2004 and is based in Ottawa, Canada.
History
- Shopify Inc. was incorporated on September 28, 2004.
- Shopify grew out of Snowdevil, an online snowboard store for which Tobi Lütke built e-commerce software.
- Shopify launched its commerce platform in 2006.
- Shopify priced its May 2015 initial public offering at $17 per share, sold 7.7 million shares and raised $131 million.
- Shopify shares closed their first trading day in May 2015 at $25.86, up 51% from the IPO price.
Curiosities
- Shopify's platform facilitated $292.3 billion in gross merchandise volume during 2024.
- Shopify reported $8.9 billion of revenue for 2024, up 26% from 2023.
- Merchant solutions represented 74% of Shopify's 2024 revenue, while subscription solutions represented 26%.
- Shopify Payments facilitated $181.0 billion of 2024 gross merchandise volume, with a 61.9% penetration rate.
- No single merchant represented more than 5% of Shopify's total revenue in any single reporting period through 2024.